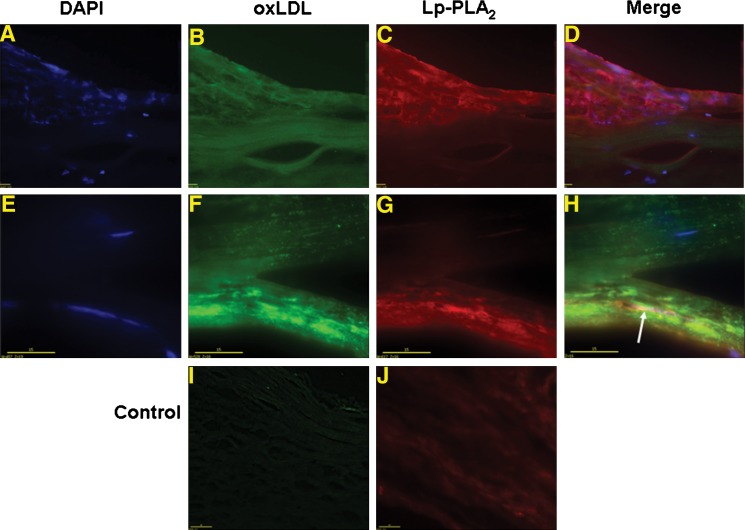
Fig. 4.
Microscopy distribution of Lp-PLA2 and oxLDL in CEA tissues. Deconvoluted microscopy localization of Lp-PLA2 (mAb-2C10 and red Alexa546) and oxLDL (mAb-4E6 and green Alexa488). A–D illustrate inflammation pattern (bar = 20 μm, 20×). E H illustrate oxLDL distribution pattern (bar = 15 μm, 60×). I and J are control experiments with unlabeled antibody prior to conjugated primary antibody incubation (bar = 40 μm, 20×).

