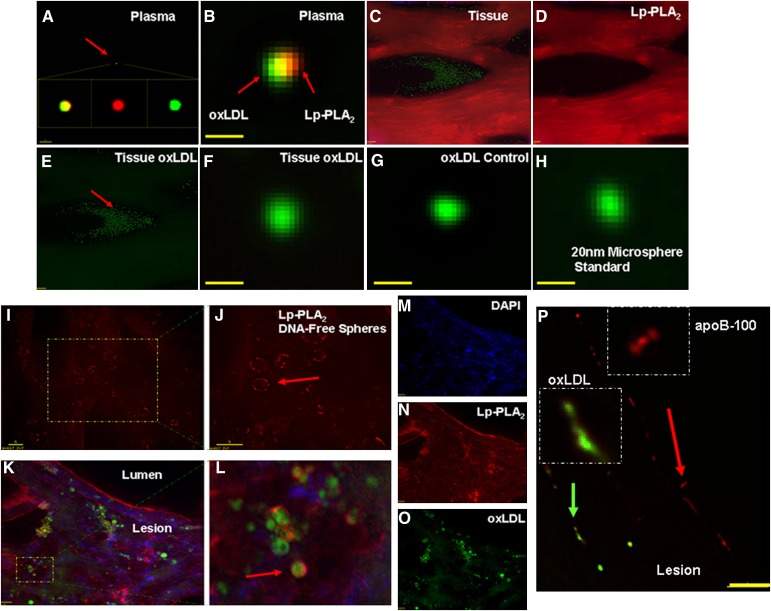
Fig. 5.
Colocalization of Lp-PLA2 and oxLDL in CEA tissues by deconvoluted microscopy. Localization of Lp-PLA2 (red, Alexa546), oxLDL (green, Alexa488), and DNA (blue, DAPI). A: Composite of plasma colocalization; red arrow indicates plasma oxLDL; B: enhanced view (100× +, bar = 20 nm). C–E: Microscopy distribution of atheroma Lp-PLA2 and oxLDL (20×, bar = 20 μm). F: Tissue oxLDL (100× + enhanced, bar = 20 nm). G: oxLDL positive control. H: Fluorescent microsphere standard (20 nm). I, J: Lp-PLA2 localized to the surface of DNA-free spheres (4′,6-diamidino-2-phenylindole [DAPI]) (100×, bar = 5 μm). K: Multiplex image of panels M O (20×, bar = 20 μm). L: Enhanced view of K. P: apoB-100 (pAb-qDot625, red arrow) and oxLDL (mAb-qDot525, green arrow) (100×, bar = 5 μm).

