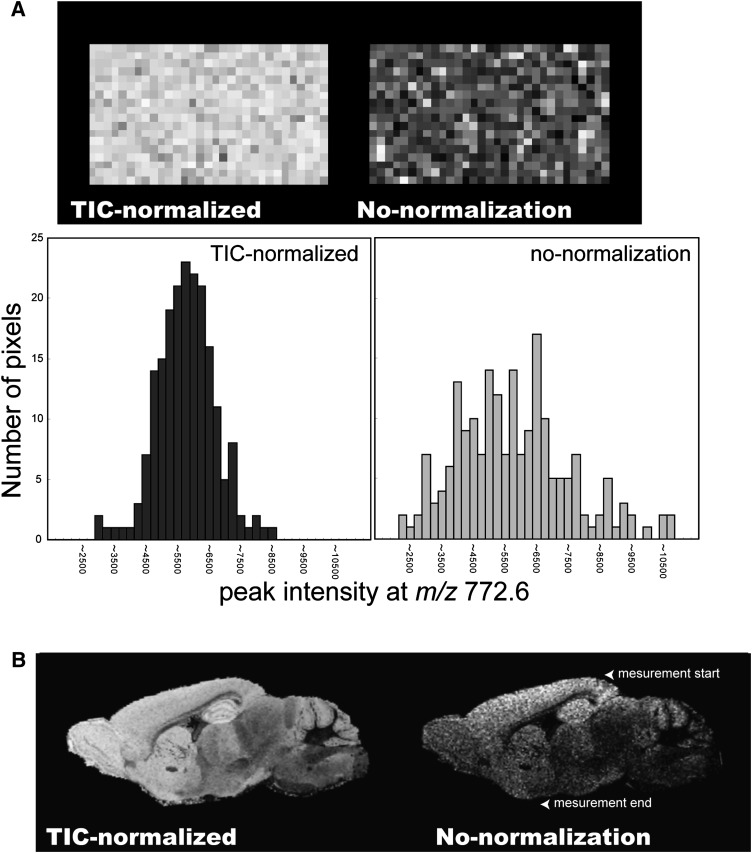
Fig. 2.
Spectrum normalization using TIC improves the visualization quality of IMS. A: IMS results for PC (diacyl-16:0/16:0) on a section of mouse brain homogenate, processed with/without TIC-normalization (upper panel), and plot of ion-intensity distribution for PC (diacyl-16:0/16:0) obtained from a brain-homogenate section, with/without TIC-normalization (lower panel). B: Ion images of PC (diacyl-16:0/16:0) on an adult mouse brain section, in which spectra were processed with/without TIC-normalization.

