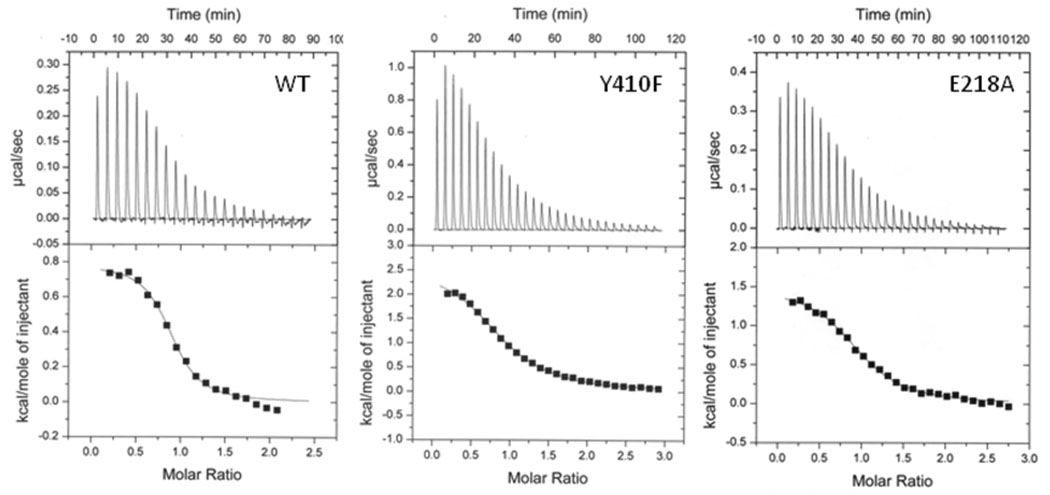
Figure 4.
Isothermal titration calorimetry plots for wildtype, Y410F and E218A MtIPMS. Experiments were performed as described in Materials and Methods. The results from a fit of the data to a One Set of Sites model produced the following values for the binding of L-leucine to the wild-type (N = 0.86 ± 0.02, ΔH = 774 ± 20 cal/mol, ΔS = 27.8 cal/mol/K), Y410F (N = 0.91 ± 0.01, ΔH = 2598 ± 48 cal/mol, `S = 30.1 cal/mol/K) and E218A (N = 0.97 ± 0.01, ΔH = 1486 ± 31 cal/mol, ΔS = 28.5 cal/mol/K) enzymes.

