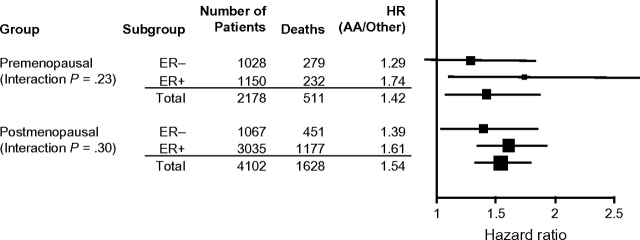
Figure 2.
Forest plot of the associations between survival and race among premenopausal and postmenopausal breast cancer patients by estrogen receptor (ER) status. A vertical line representing no effect (HR = 1) is shown. The area of each square is proportional to the sample size for the subgroup, and the length of the whiskers indicate the 95% confidence intervals. P values for interaction are shown. The Wald χ2 test statistic for the effect of race on survival in the multivariate setting is also included. All statistical tests were two-sided. HR = hazard ratio; AA = African American.

