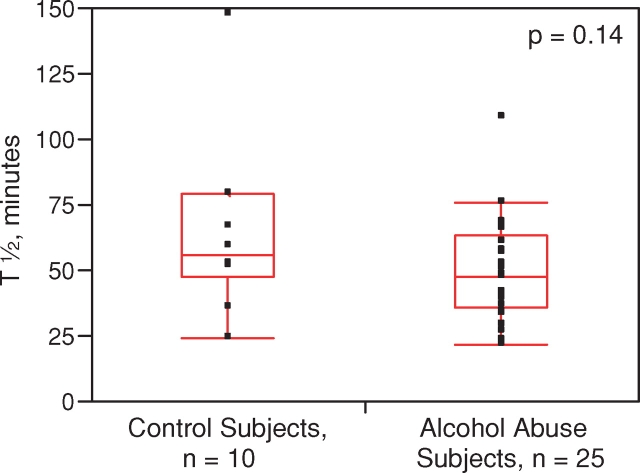
Fig. 2.
Measured half-life of 99mTc–DTPA tracer in lungs of subjects with alcohol abuse and controls who are smokers. Middle of boxplot is the median, while bottom and top represent the 25th and 75th percentile of values, respectively. Whiskers (where present) represent the 5th and 95th percentile of values. This figure appears in colour in the online version of Alcohol and Alcoholism.

