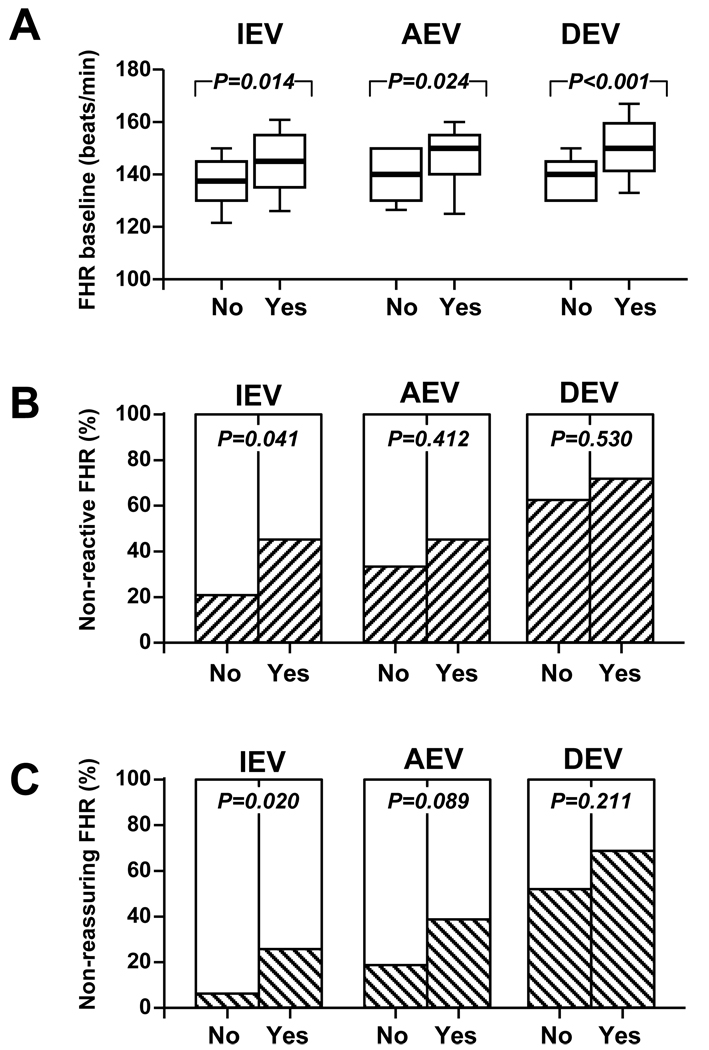
Figure 4. Fetal heart monitoring patterns and funisitis (grades 2–4) Panel A.
FHR baseline levels of fetuses with grades 2–4 funisitis (Yes, n=33) versus those without funisitis or with grade 1 funisitis (No, n=48). The ends of the boxes define the 25th and 75th percentiles, the line inside the box defines the median and the whiskers show the largest and smallest values. Statistical comparisons: Mann-Whitney tests. Panel B: Percent of fetuses with non-reactive FHR monitoring patterns (hashed bars) in the group of fetuses with grades 2–4 funisitis (Yes, n=33) versus those without or with grade 1 funisitis (No, n=48). Statistical comparisons: Chi square tests. Panel C: Percent of fetuses with non-reassuring FHR monitoring patterns (hashed bars) in the group with MR scores 3 or 4 (Yes) versus those with MR scores 0, 1 or 2 (No). Statistical comparisons: Fisher’s exact or Chi square tests. IEV (initial evaluation), AEV (amniocentesis evaluation) and DEV (delivery evaluation) represent the times when the strips were scored.

