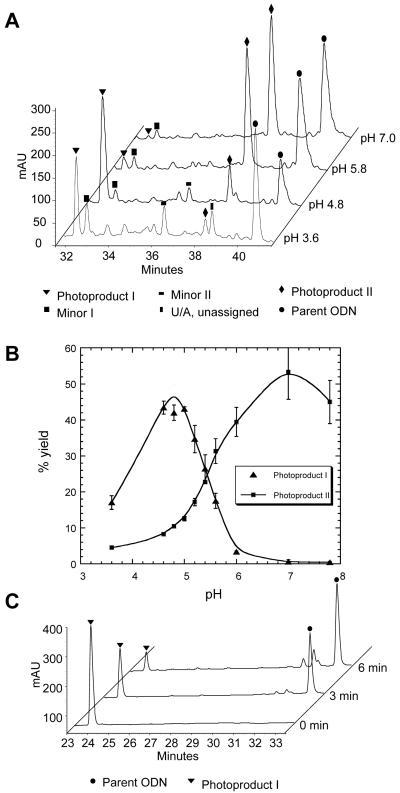
Figure 2.
HPLC analysis of photoproduct formation and reversal A) Reverse phase HPLC analysis with method A of UVB irradiation mixture of d(GTATCATGAGGTGC) at different pHs. Accurate m/z of the molecular ion [M+H]+ of the unknown photoproduct I is 4317.7778 with mass error of +3.1 ppm comparing with a calculated value of 4317.7644. B) Plot of the percent yield (calculated by peak area) of photoproduct I and the photoproduct II-Dewar photoproduct as a function of pH. The error bars were produced from three independent trails of experimental data. C) Reverse phase HPLC analysis with method B of the products of 254 nm irradiation of photoproduct I for 0, 3 and 6 min. The major reversion product was confirmed to be the parent ODN by MALDI analysis of the PDE I and PDE II digestion products. The smaller peaks eluting around 32 min are attributable 254 nm irradiation products of the reversal product, as confirmed by separate irradiation of the parent ODN.

