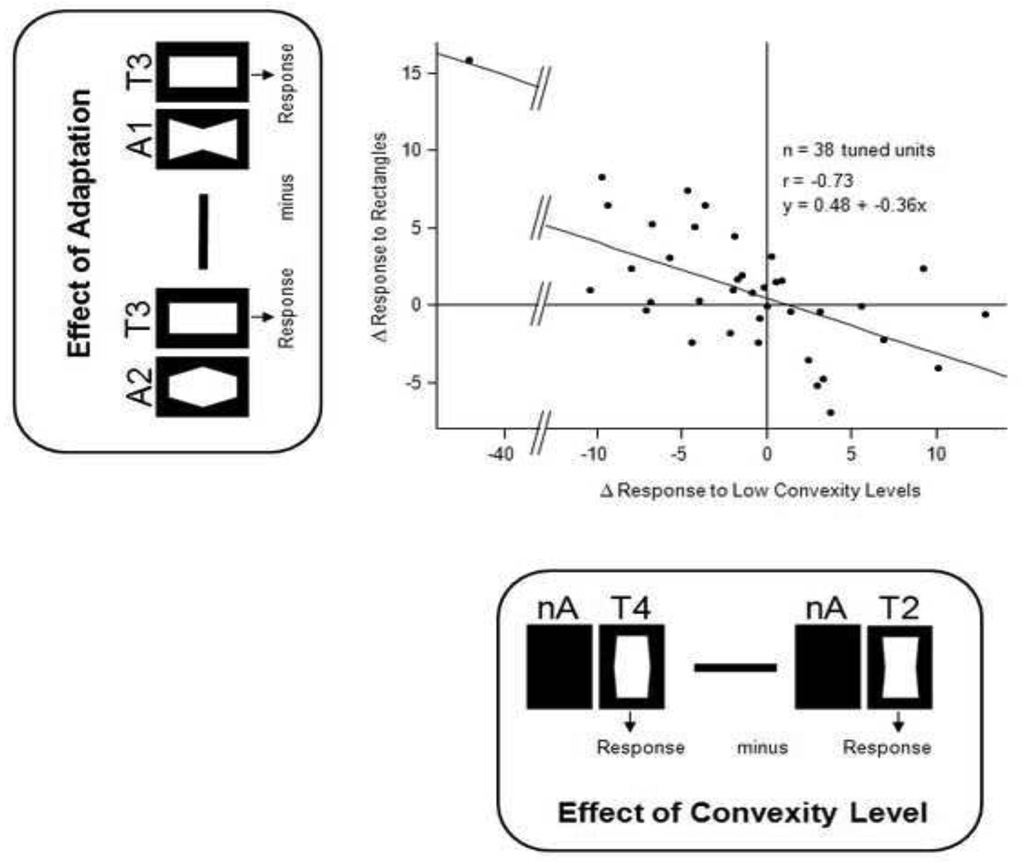
Figure 3.
Negative correlation between convexity tuning and the effects of adaptation on the response to the zero-convexity test stimulus. All single units with significant tuning to one of the 5 test stimuli were included in this analysis, with each dot corresponding to one unit. Values on the x-axis show responses to low convexity levels without previous adaptation (nA): Mean firing rate to T2 was subtracted from mean firing rate to T4. The y-axis shows differential effects of convex (A2) and concave (A1) adaptation on response to test rectangle (T3). Note the high correlation with negative slope between the two differential measures, indicative of a negative aftereffect.

