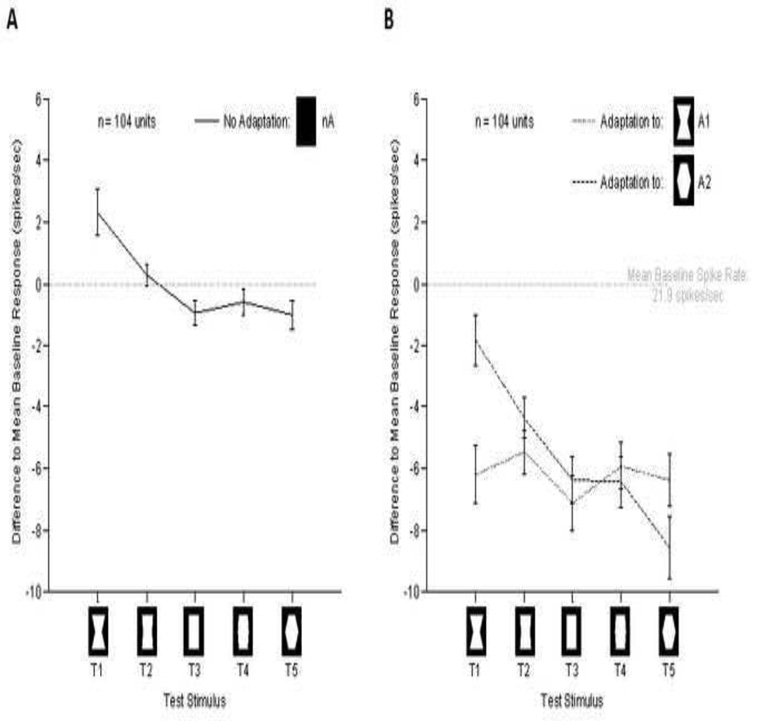
Figure 4.
Nonspecific and specific effects of adaptation. The y-axis marks the difference to the mean baseline activity. X-axis shows the different test stimuli. Error bars represent the standard error of the mean. (A) Average response to the test stimuli across the population. Note the overall preference to the globally concave stimulus. (B) Population tuning following adaptation. Note that the most prominent effect was a significant overall decrease in firing following adaptation. In addition there was a smaller stimulus specific effect of adaptation, which can be inferred by comparing the responses to T1 and T5 following different adaptors.

