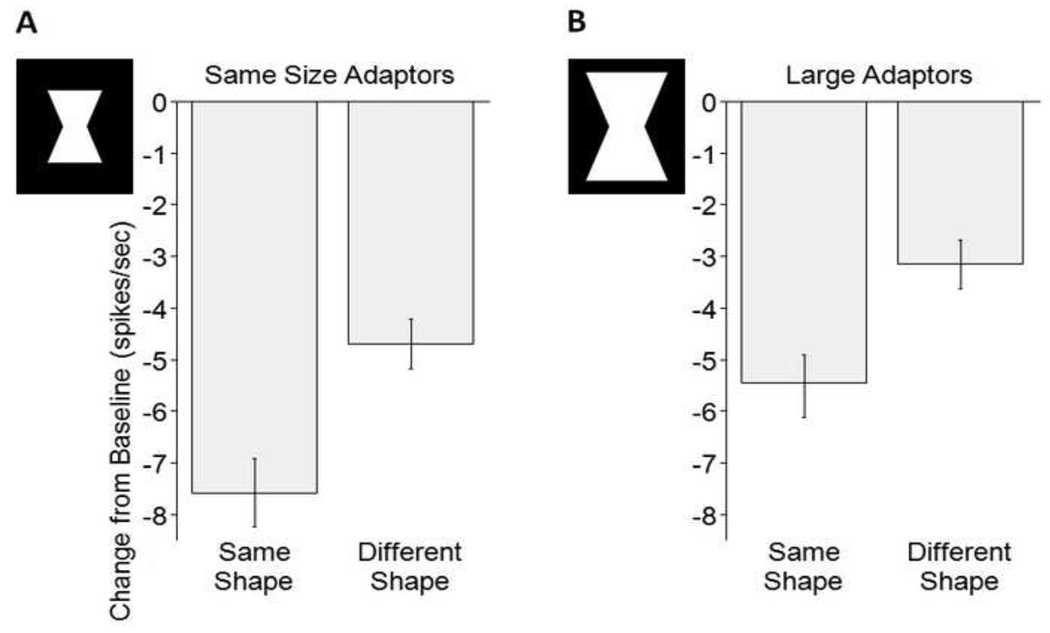
Figure 5.
Size-independent pattern specificity of adaptation (N=104 single units, 2 conditions per unit combined in each data point). Here, the pooled effects of the convex and the concave adaptors onto T1 or T5 respectively are depicted. The stimuli illustrate the size difference. Convex adaptors were of the same area as the concave adaptors shown here. (A) Average difference between adapted and baseline firing is 7.6 spikes/sec for the same shapes vs. 4.7 spikes/sec for different shapes. Error bars indicate standard error of the mean. (B) Larger size refers to adaptors of the same shapes but 2.25 times the area. Note that the pattern selective adaptation effect remains despite a change in the adaptor size.

