
Figure 5.
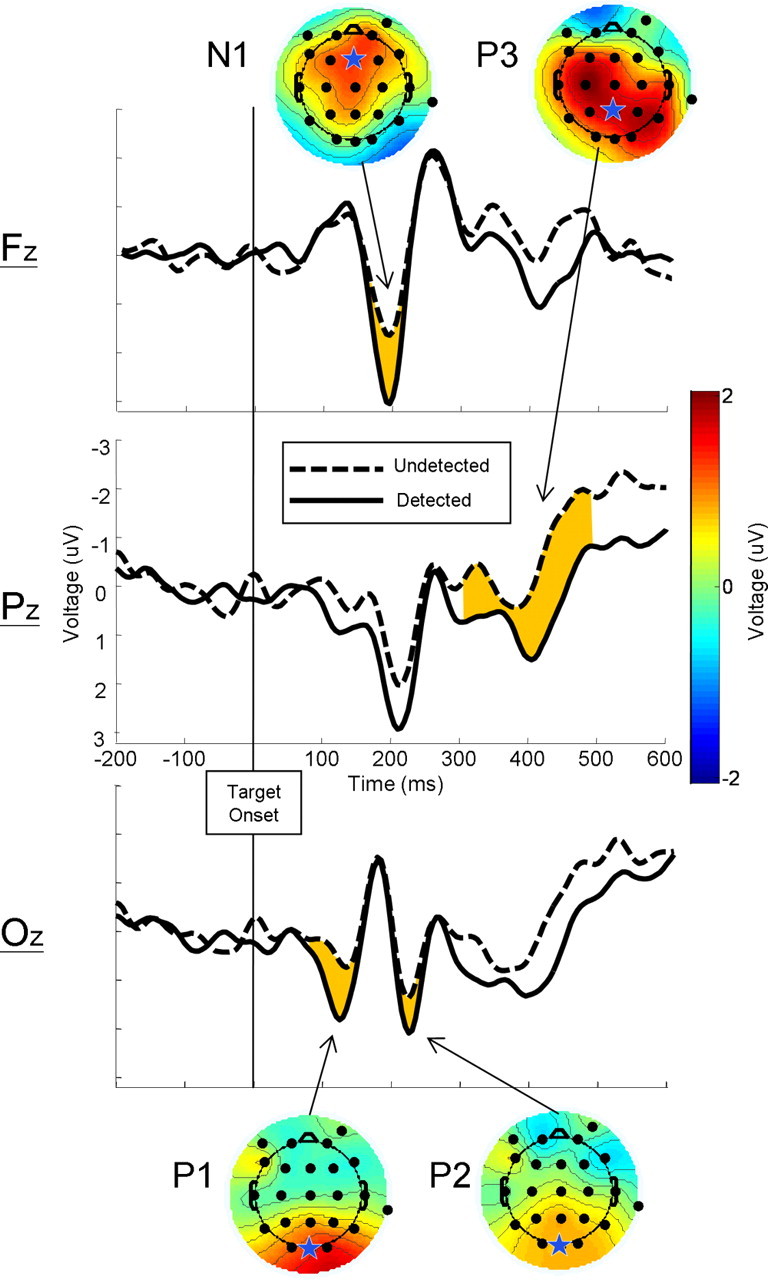
Difference waves created by subtracting ERPs on mask-only trials from masked target trials, yielding waveforms representing the activity resulting from the detected (solid) and undetected (dashed) targets, plotted at three locations (Fz, Pz, Oz) along the midline. Shaded waveform regions represent analyzed time windows in which the mean voltage was reliably greater for detected targets than for undetected targets. Stars represent channels from which analysis measurements were taken for each component. Interpolated scalp voltage maps of the difference between detected and undetected trials at the peak difference for components P1, N1, P2, and P3.