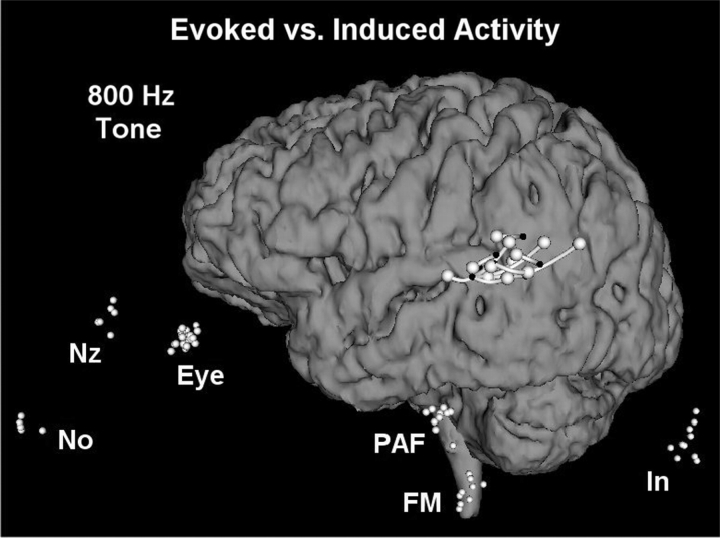
Fig. 3.
The location of the inversion of the initial component of the left hemisphere auditory evoked potential to tone stimulation for eight patients determined the location of primary auditory cortex (small black dots), compared to the location of tone-induced gamma activity (large white spheres). Pipes link data from individual patients. Small white dots indicate the location of each subject's fiducial points after registration with the fiducial points within the MRI from Patient 5.

