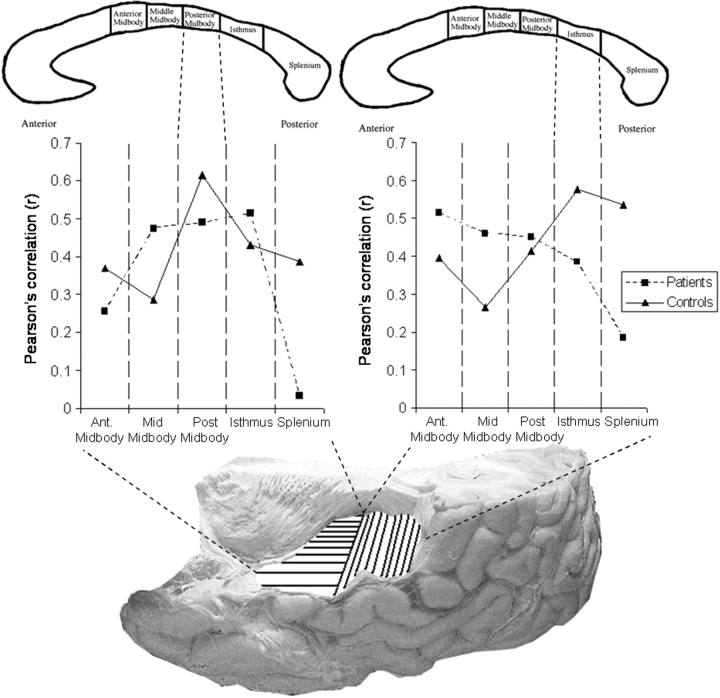
Fig. 2.
Bottom: Image of the superior surface of the left temporal lobe. HG (horizontal shading) and PT (vertical shading) project through different subregions of the corpus callosum. Top: Two images of the corpus callosum. For HG the key subregion (upper left) is identified, by dotted lines linking it to the graph on the left, as the posterior midbody, for PT the key subregion (upper right) is the isthmus, linked by dotted lines to the graph on the right. Middle: The middle graphs show correlations between minicolumn number asymmetry and axonal fibre number for subregions of the corpus callosum. Middle left: Pearson r-values are plotted for HG primary auditory cortex against the five subregions. Middle right: Pearson r-values are plotted for PT association cortex against the five subregions. For both graphs, control subject data are represented by triangles (solid line) and patient data by squares (dashed line). [r-Values are directionless (√r2) to ease comparison, indicating a correlation between increasing axon number and either increasing leftwards asymmetry (for HG) or decreasing leftwards asymmetry (for PT).] In controls, a clear peak correlation is seen for the subregions through which the respective cortical regions (HG and PT) are known to project. However, this peak correlation is not clear and is not selective to the appropriate subregion in patients.

