Fig. 3.
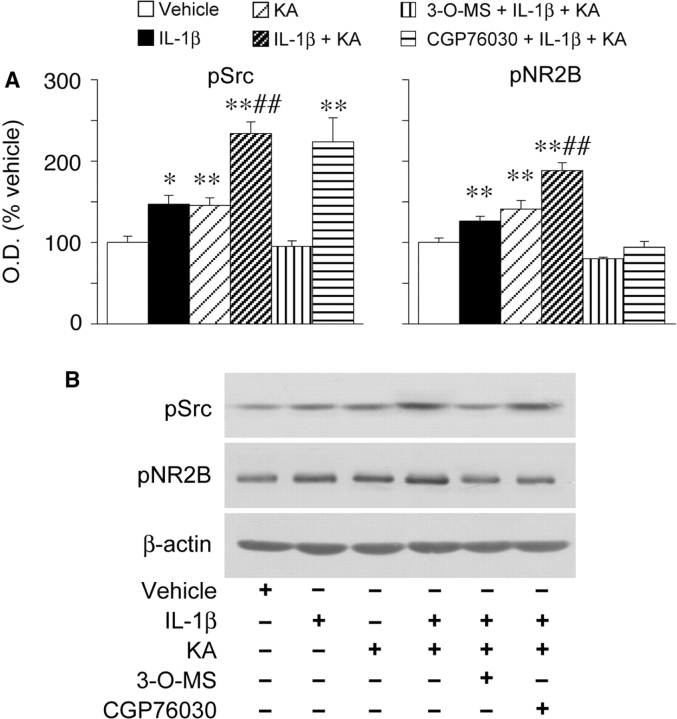
IL-1β and seizure induced tyrosine phosphorylation of Src-family of kinases and the NR2B subunit of the NMDA receptor: effect of pharmacological treatments. Bargrams show densitometry analysis of the Src kinases and NR2B bands corresponding to their phosphorylated (p) forms (Src-Tyr418; NR2B-Tyr1472) in the various experimental groups, 60 min after the onset of kainate-induced seizures (∼70 min after kainate injection), as assessed by western blot analysis of hippocampal homogenates. Vehicle- or IL-1β alone- treated mice were killed 70 min after the injection. Data (means ± SE, n = 5–7) are optical density (O.D.) values of the relevant bands (as depicted in the representative western blot), divided by the corresponding β-actin value (internal standard). Data are expressed as percentage of values measured in corresponding vehicle-treated mice. IL-1β (1 ng/0.5 μl) was injected alone or 10 min before kainic acid; 3-O-MS (3 µg/0.5 µl) and CGP76030 (65 ng/0.5 µl) were injected 20 min before kainic acid (i.e. 10 min before IL-1β). 3-O-MS or CGP76030 alone did not change protein phosphorylation levels as compared to vehicle-injected mice; total NR2B levels were not changed by the various treatments (not shown). *P < 0.05; **P < 0.01 versus vehicle; ##P < 0.01 versus 3-O-MS+IL-1+KA and versus CGP76030+IL-1+KA (for pNR2B only) by two-way ANOVA followed by Kruskal–Wallis test. Representative western blot bands corresponding to the specific proteins are depicted in B.

