Figure 1.
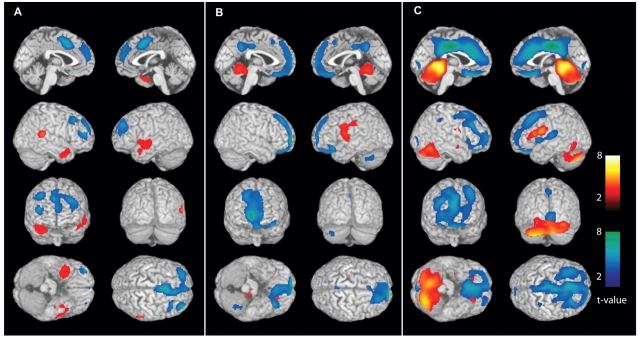
Secondarily generalized tonic–clonic seizures are associated with CBF changes in cortical and subcortical networks. Data from L-R combined analyses are shown (see ‘Methods’ section). Statistical parametric maps depict CBF increases (warm colours) and decreases (cool colours) compared with baseline interictal images. (A) Pre-generalization period (n = 12). Increases in the temporal lobes (the most common region of seizure onset) do not reach statistical significance at the cluster level, while significant decreases occur in the cingulate gyrus and frontal association cortex. (B) Generalization period (n = 12). Significant increases at the cluster level occur in the superior medial cerebellum, left thalamus and basal ganglia, while significant decreases occur in the frontal association cortex. Note that thalamic and basal ganglia increases are not visible in these surface renderings (see Fig. 2B for subcortical changes) except for where they artifactually appear on the lateral surface in the second row, right image (left lateral brain view). In fact, no significant cortical increases occur in the group analysis during the generalization period (Fig. 2B, Table 1). (C) post-ictal period (n = 35). Significant increases occur in the cerebellum and dorsal midbrain, while decreases occur in the frontal association cortex, cingulate and precuneus. As in the generalization period, no significant cortical increases occur, but some of the basal ganglia signal appears on the lateral surface due to the surface rendering algorithm. For A–C, extent threshold, k = 125 voxels (voxel size = 2 × 2 × 2 mm3). Height threshold, P = 0.01. Equivalently, only voxel clusters greater than 1 cm3 in volume and with Z scores greater than 2.33 are displayed. Only regions with corrected P < 0.05 are considered significant at the cluster level (Table 1).

