Figure 2.
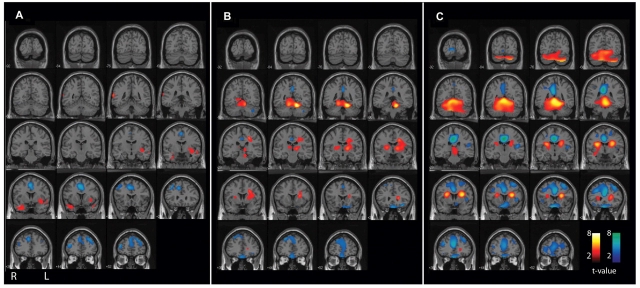
CBF changes associated with secondarily generalized tonic–clonic seizures (L-R combined analysis), with results overlaid on a structural MRI in the coronal plane. Same patients and data are shown as in Fig. 1. Statistical parametric maps depict CBF increases (warm colours) and decreases (cool colours) compared with baseline interictal images. (A) Pre-generalization period (n = 12). Increases in the temporal lobes (the most common region of seizure onset) do not reach cluster-level significance (Table 1), while significant decreases occur in the cingulate gyrus and frontal association cortex. (B) Generalization period (n = 12). Significant increases at the cluster level occur in the superior medial cerebellum, left thalamus and basal ganglia, while significant decreases occur in the frontal association cortex. (C) post-ictal period (n = 35). Significant increases occur in the cerebellum and midbrain, while decreases occur in the frontal association cortex, cingulate and precuneus. Increases in basal ganglia and adjacent white matter do not reach cluster-level significance. For A–C, extent threshold, k = 125 voxels (voxel size = 2 × 2 × 2 mm3). Height threshold, P = 0.01. Equivalently, only voxel clusters greater than 1 cm3 in volume and with Z scores greater than 2.33 are displayed. Only regions with corrected P < 0.05 are considered significant at the cluster level (Table 1).

