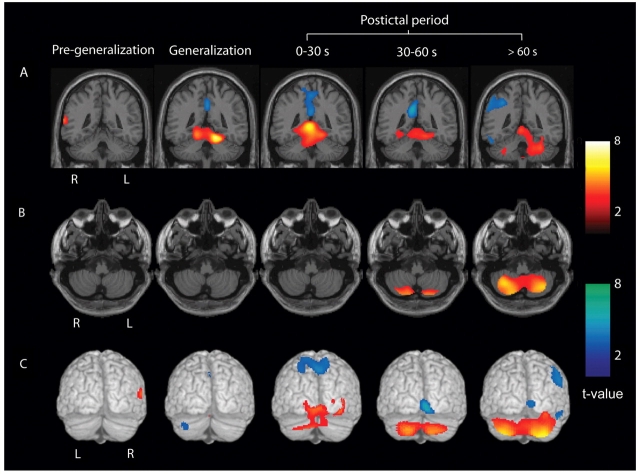
Figure 6.
Evolution of cerebellar CBF increases from the superior medial cerebellum to the lateral cerebellar hemispheres. Statistical parametric maps depict CBF increases (warm colours) and decreases (cool colours) compared with baseline interictal images. (A) CBF increases and decreases overlaid on a structural MRI in the coronal plane demonstrates superior medial cerebellar increases peaking during the generalization and early post-ictal (0–30 s) periods. (B) Axial sections through the inferior cerebellum demonstrating lateral cerebellar increases most prominent at late post-ictal times (>60 s). (C) Posterior surface renderings demonstrating medial to lateral evolution of cerebellar CBF increases during the post-ictal period. (A–C) Group analyses were performed for SPECT injections during the pre-generalization (n = 12), generalization (n = 12), early post-ictal (0–30 s, n = 12), middle post-ictal (30–60 s, n = 13) and late post-ictal (>60 s, n = 10) periods. Patients were the same as in Fig. 1 and 2. SPM extent threshold, k = 125 voxels (voxel size = 2 × 2 × 2 mm3). Height threshold, P = 0.01.

