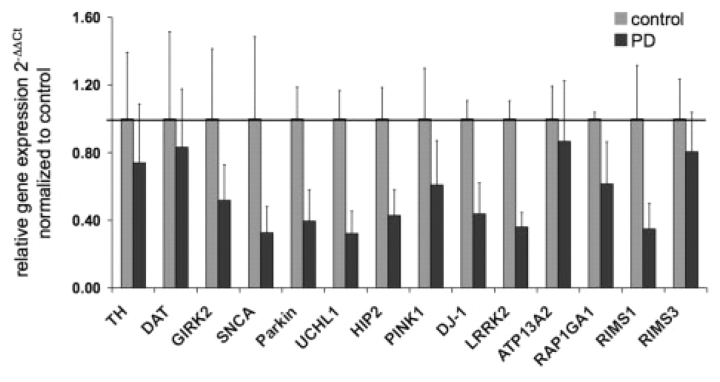
Figure 1.
Validation of gene expression using TaqMan® real-time PCR on three control and three Parkinson's disease samples (Table 1). The following genes were selected: tyrosine hydroxylase (TH), dopamine transporter (DAT), Girk2 (KCNJ6), SNCA (PARK1), Parkin (PARK2), UCHL1 and HIP2 (PARK5), PINK1 (PARK6), DJ-1 (PARK7), LRRK2 (PARK8), ATP12A2 (PARK9), RAP1GA1, RIMS1 and 3 (PARK10). Data analysis was based on the 2−ΔΔCt method (Livak and Schmittgen, 2001; Schmittgen and Livak, 2008) and results were plotted as fold differences of relative gene expression normalized to controls.

