
Figure 1.
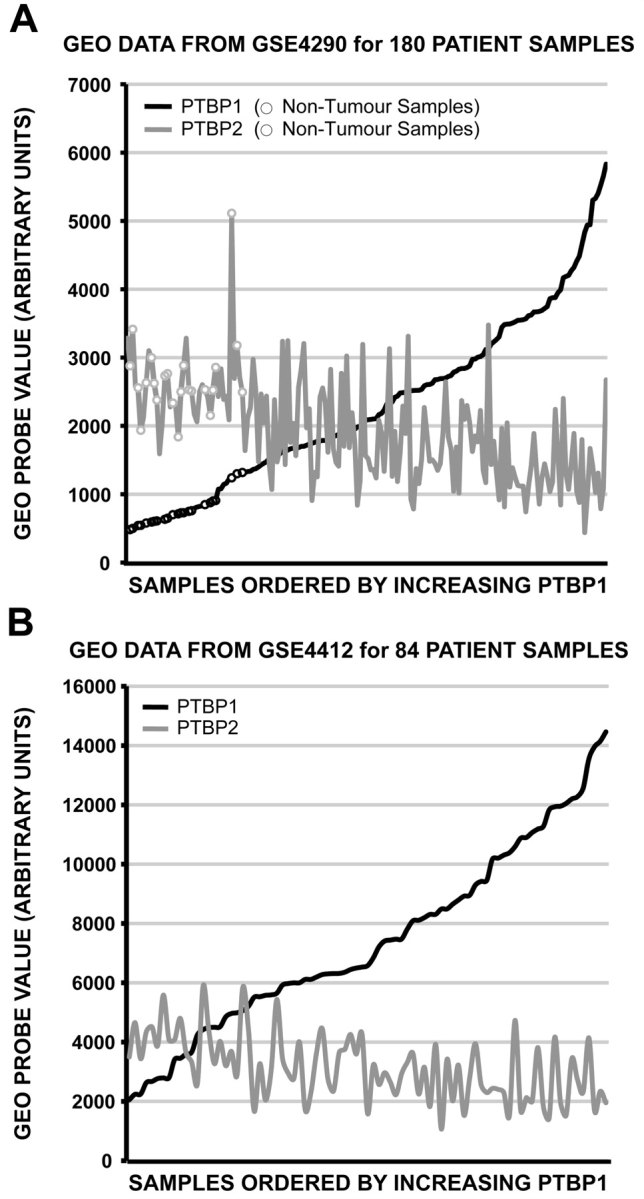
PTBP1 overexpression correlates with PTBP2 repression. Expression array values from two independent GEO datasets were plotted comparing PTBP1 and PTBP2 levels in the same sample. The patient samples are ordered by increasing PTBP1 expression. (A) Plot of GSE4290 dataset values. The expression levels for 23 non-tumour samples are indicated as open circles. (B) Plot of GSE4412 dataset values.