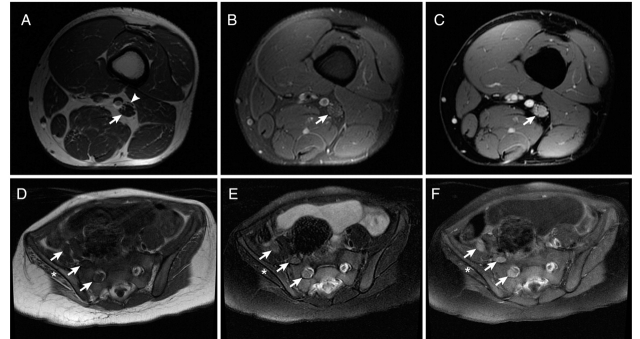
Figure 3.
MRI characteristics of perineurioma. Patient 5: (A) 3.0-T axial T1-weighted fast spin echo (FSE) image shows marked enlargement of the individual fascicles of the tibial division of the sciatic nerve in the mid thigh (arrow). The peroneal division is unaffected (arrowhead). (B) Axial T2-weighted FSE image with fat suppression at the same level demonstrates very mild T2 hyperintensity in the tibial division of the sciatic nerve (arrow). (C) Axial T1-weighted spoiled gradient recalled (SPGR) image with fat suppression after contrast administration at the same level shows prominent enhancement of individual fascicles within the tibial division of the nerve (arrow). Patient 3: (D) 1.5-T axial T1-weighted FSE image shows marked enlargement of the femoral nerve (rightmost arrow with respect to the patient), lumbosacral plexus (middle arrow) and the S1 root (left-most arrow with respect to the patient). (E) Axial T2-weighted FSE image shows mild T2 hyperintensity of the nerves (arrows). (F) Axial T1-weighted FSE image after contrast administration shows mild hyperintensity and avid enhancement of the nerves. There is oedema within the atrophied gluteus muscles on the right consistent with a combination of subacute and chronic denervation (asterisk).

