
Figure 1.
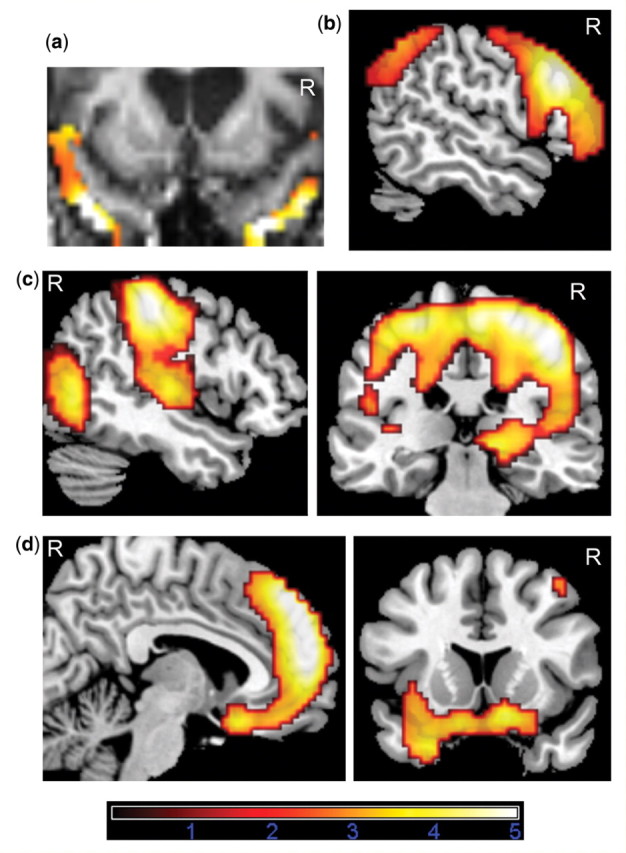
FDG-PET analysis using SPM5. (A) shows an example of a single case analysis in which hypometabolic clusters in an FTLD patient surviving FDR-corrected P = 0.05 over the volume of the bilateral apriori aTL ROI were overlaid onto his normalized MRI to determine whether anterior temporal cortex inferior or within or superior to the superior temporal sulcus showed hypometabolism. (B) Common areas of hypometabolism in FTLD versus Normal controls and CBS versus Normal controls (inclusive mask at P = 0.005). (C) Hypometabolism in CBS versus FTLD. (D) Hypometabolism in FTLD versus CBS. Areas exceeding a voxel level threshold of P = 0.005 uncorrected, five voxels are displayed. Only regions which additionally survive FWE- or cluster-corrected P = 0.05 over the whole brain or bilateral apriori aTL ROI are reported in Table 1 and discussed in text.