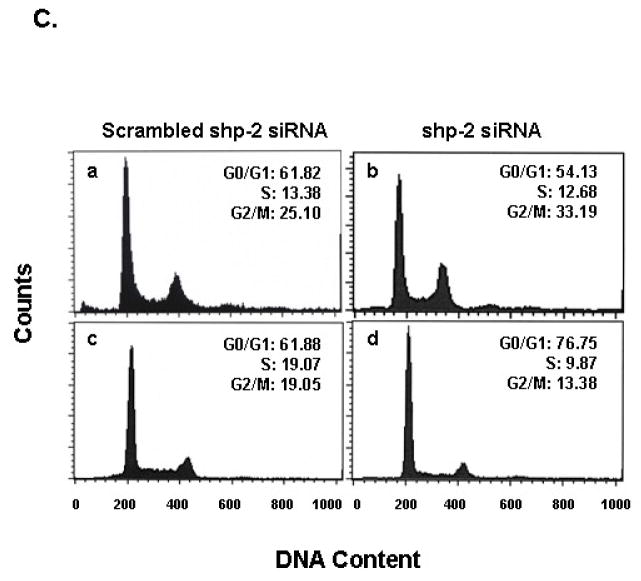
Fig. 6. PTPase defective Shp-2 expression results in G2/M cell cycle arrest and decreases Cdc2(Tyr15) phosphorylation in U87MG.EGFRvIII cells.
(A) 5×10⁵ U87MG.EGFRvIII cells expressing empty vector (a, d), Shp-2 wild-type (b, e) and PTPase-defective Shp-2 C459S (c, f) were seeded in 10-cm dishes in the presence of 10% serum. After cells attached to the dish, one group of cells was maintained in 10% FBS (a, b, c) and in an additional group, 10% FBS medium was replaced with 0.5% FBS (d, e, f). All cells were then cultured for 72 h. Cells were then trypsinized and the DNA content was analysized by a fluorescence-activated cell sorter. The cell distribution in G0/G1, S, and G2/M phase and the percentage of cells are indicated in the histogram. Similar results were obtained in four independent experiments (n=4). (B) Cells were split and allowed to attach to plates in 10% FBS. For one group, 10% FBS medium was replaced with 0.5% FBS and all cells were cultured for an additional 72 h. Cells were then harvested for western blot analysis. Equal amounts of protein were loaded and examined with anti-phospho-Cdc2(Tyr15), anti-Cdc2 and anti-actin antibodies. Three separate experiments were performed (n=3). (C) Cells were transfected with different amounts of scrambled shp-2 siRNA (a, c) and shp-2 siRNA (b, d) for 6 h and cultured in 10% serum for an additional 5 days. Cells were then trypsinized and the DNA content was analysized. The cell distribution in G0/G1, S, and G2/M phase is shown (a and b are U87MG.EGFRvIII cells; c and d are LN229.EGFRvIII cells). Similar results were obtained in two to three independent experiments (n=2–3).


