
Figure 7.
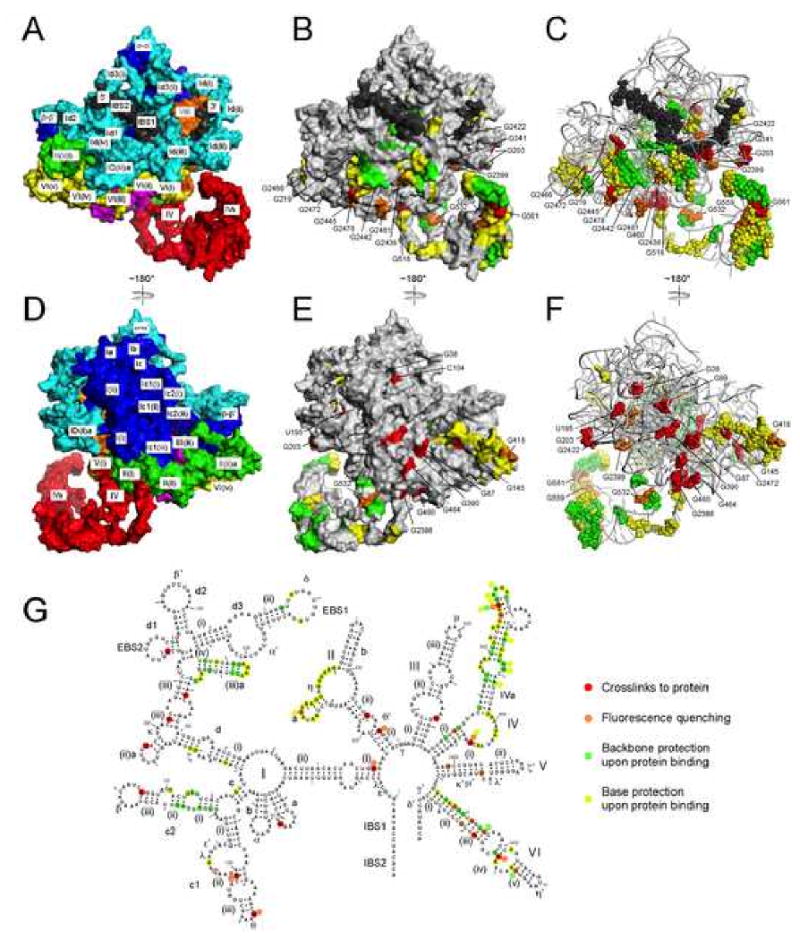
Interaction sites between the IEP and intron RNA.
A, D. Surface representation of the ribozyme model, color-coded as in Figures 4 and 5. Exons are black.
B, E. Gray surface representation of the RNA model, with putative protein contact sites color-coded according to the method of detection. Nucleotide positions identified by cross-linking and fluorescence quenching are specified with residue numbers; a few residues are not visible from the angle shown.
C, F. Alternative view of the model with putative protein contacts shown as spheres.
G. Summary of protein contact data, and definition of the color-coding scheme for panels B, C, E and F. Backbone and base protections are from Matsuura et al. (2001), and include all strong protections in Figures 3 and 4 of that work, as well as moderate protections in regions deemed to be sites of protein contacts as discussed in that manuscript. For residues that gave data by more than one method, the color was determined by the priority of red > orange > green > yellow. The red open circle indicate the nearest exposed residue to G99.