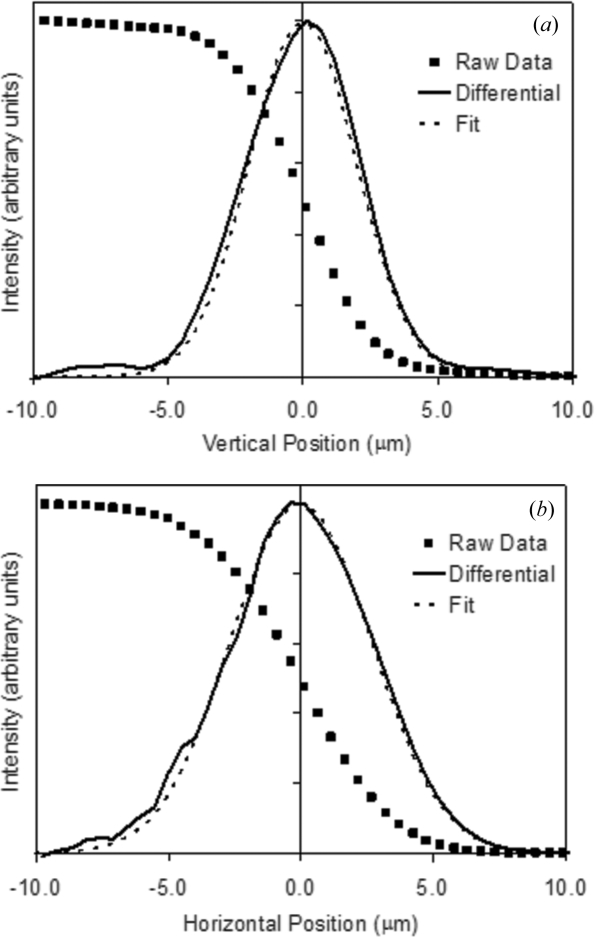
Figure 6.
Profiles of the mini-beam defined by the 5 µm aperture in the vertical (a) and horizontal (b) directions. Profiles were recorded at the sample position using a knife-edge scan as described in the text. The raw knife-edge scans were differentiated, providing the beam profile (solid line). An error function was fit to the raw data (not shown). The best-fit Gaussian is derived from the derivative of the error function (dashed line).

