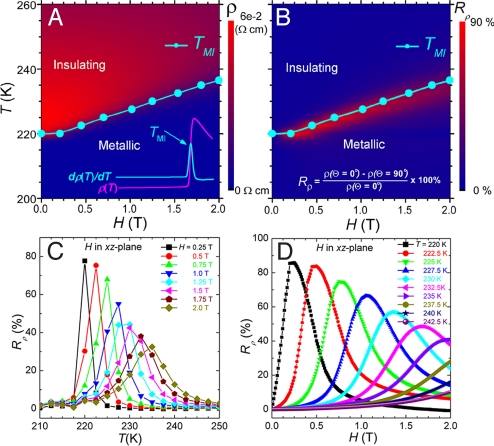
Fig. 2.
Correlation between MIT and AMR of La0.69Ca0.31MnO3. (A) T- and H- (along c-axis) dependence of the resistivity (ρ) and TMI defined as the peak temperature in dρ/dT − T curve (see the Inset). (B) A contour plot and line plots of (C) the T- and (D) H-dependence of the measured Rρ from the slab single crystal as the field was applied in the xz plane (thus including Lorentzian MR). The solid lines through the data points are guides to the eye.

