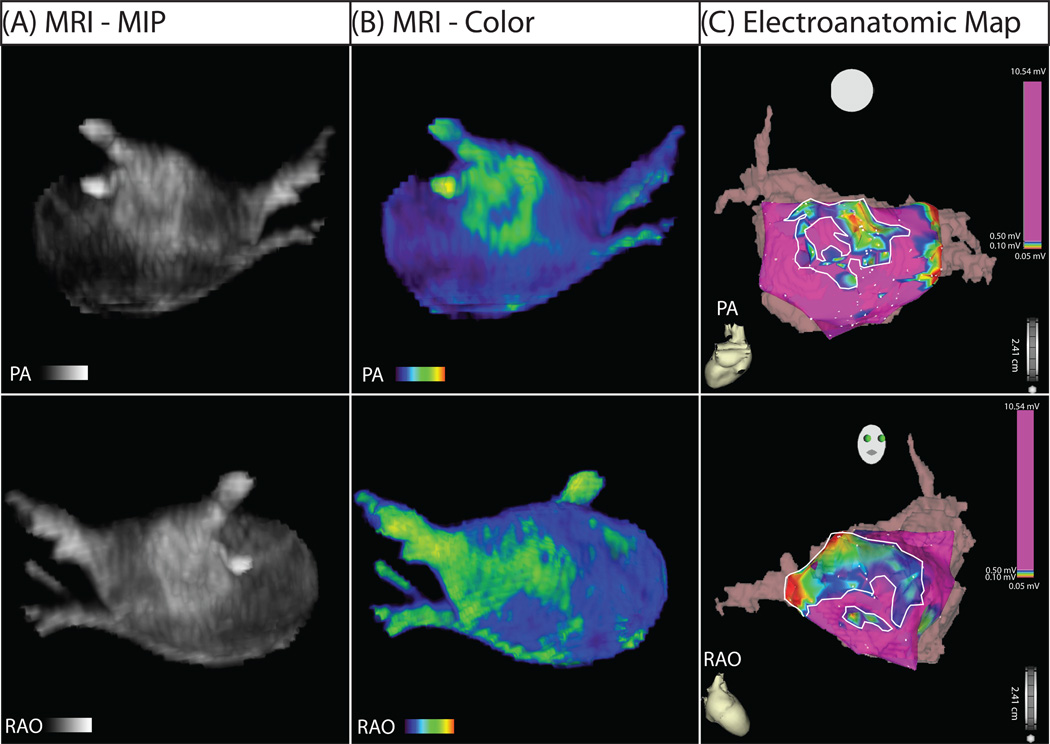
Figure 1. MRI relationship with EA map in posterior (PA) and right anterior oblique (RAO) views.
(A) Segmented DE-MRI reveals discrete areas of enhancement in the posterior wall and the septal area. (B) Color 3D models improve dynamic range and better illuminate enhancement patters. (C) EA map acquired during invasive EP study. Discrete patterns of low voltage (within bounded white lines) were detected in the left posterior wall and the septum in the patient shown which correlate with the regions of DE-MRI enhancement.

