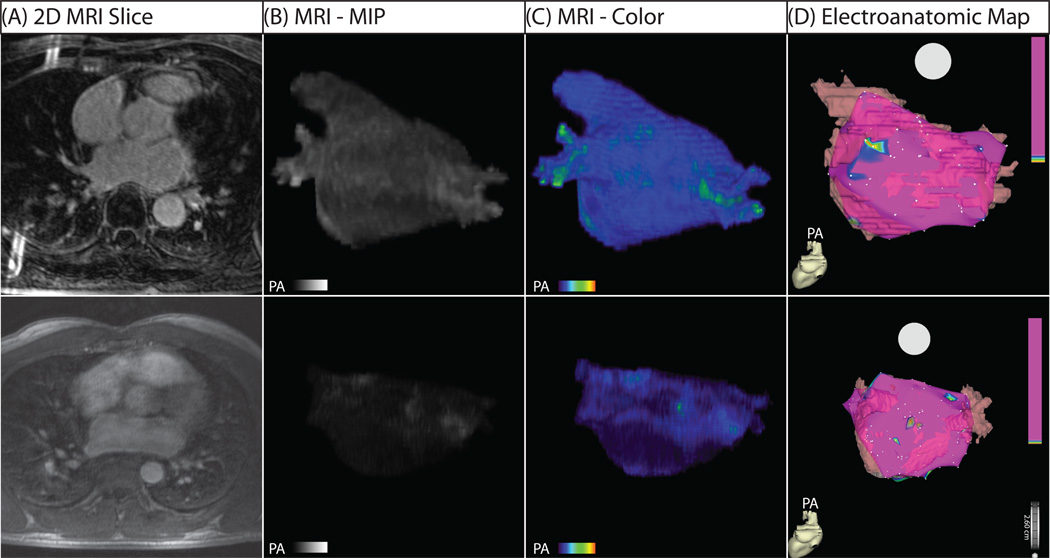
Figure 3. Three-Dimensional MRI Models in Two Patients with Mild Structural Remodeling.
(A) Two dimensional slice from DE-MRI scan. (B) 3D DE-MRI reveals minimal contrast enhancement. (C) 3D color models. (D) EA map showing electrically normal (purple) and abnormal (colored) atrial tissue. The EA map illustrates homogeneous voltages throughout much of the left atrium with small patches of electrically abnormal/low voltage tissue in nearly all patients who successfully responded to PVAI therapy. Abnormally enhanced regions on MRI correlate closely with low voltage areas on the EA maps.

