Figure 3.
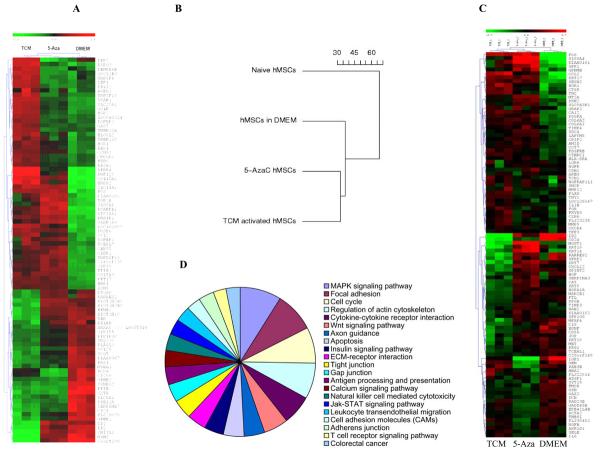
Comparative gene expression analysis of 30d TCM exposed hMSCs, 5-aza treated hMSCs and control DMEM exposed hMSCs. A, Global gene expression profile of control DMEM exposed hMSCs, 5-aza treated hMSCs and 30d TCM exposed hMSCs. The hierarchical clustering is obtained from cDNA microarray studies carried out on naïve, 5aza treated hMSCs and tumor conditioned medium treated hMSCs for 30 days. Overall gene expression profiles of 5-aza treated hMSCs and 30d TCM-exposed hMSCs are similar. Control DMEM exposed hMSCs have a different expression profile from both 5-aza treated as well as 30d TCM exposed hMSCs. The expression levels of individual transcripts are shown from green (low) to red (high). Clustering reveals an overall global gene expression profile similarity between 5-aza treated hMSCs and 30d TCM exposed hMSCs as compared to the control 30dDMEM exposed (green: lower expression and red: higher expression). There are several candidate genes that show increased expression in only the 30d TCM exposed hMSCs. B, Dendogram depicts relative differences or similarities between the 4 hMSCs samples analyzed in a hierarchical manner. The distance used for the clustering is 1–Pearson correlation between expression values (in log scale) from arrays. The 30d TCM-exposed hMSCs appear to be closer to the 5-aza treated cells in terms of global gene expression than the other control cell types. C, Pie chart of induced KEGG pathways in the MSC treated by TCM for 30 days going clockwise from MAPK signaling pathway. The areas of individual slices represent percentage of genes belonging to the particular pathway that are upregulated following activation by 30d TCM exposure (list of genes in Table-1). D, Gene expression array data from MSC exposed to TCM, 5AZA or control media were analyzed for expression of genes reported to be specifically expressed (i.e., up or down regulated) in carcinoma-associated fibroblasts. A heat-map showing relative expression of these genes amongst the 3 sample conditions is shown (red=higher relative gene expression; blue=lower relative gene expression). The heatmap presents 100 top markers of CAF out of which 53 markers are up regulated in TCM exposed MSCs and 47 markers are down regulated in TCM exposed MSCs (see text for the gene list).

