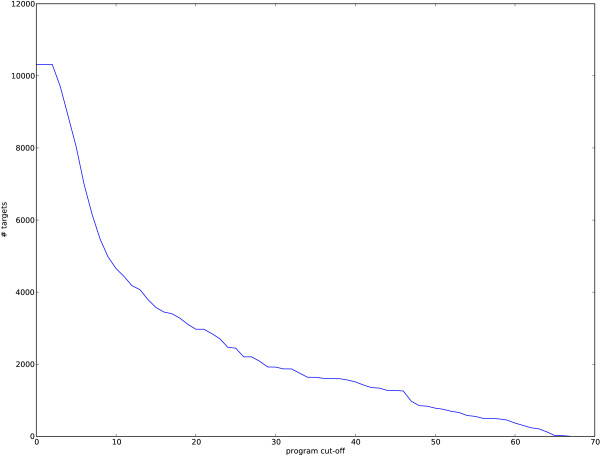
Figure 3.
Number of target genes of programs by size. We plot how many genes are targeted by the programs smaller than a given size. The programs that account for more binding sites are less interesting in terms of cooperative effects, so we plot the size of the set of all targets of all programs smaller than a given size. The size cut-off varies along the x-axis (indexed by program) and the y-axis represents the total number of genes targeted by those programs. For example, excluding the first 10 programs, just over 4,000 distinct genes are targeted by the remainder of the programs.

