Figure 7.
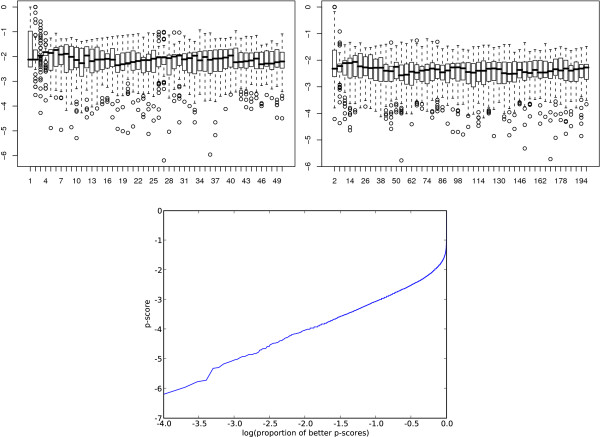
Bootstrap. Assessment of the significance of the results from the GO enrichment analysis by random samples of factors and genes. We show a boxplot of the p-scores for the randomly sampled factors on the top left and the targets on the top right. The x-axes are the sample sizes and the y-axes are the p-scores. We sampled 100 times at each of 50 different sample sizes for the factors and the targets. The lower plot shows the sorted p-scores plotted against the base 10 logarithm of the proportion that are equal or better.

