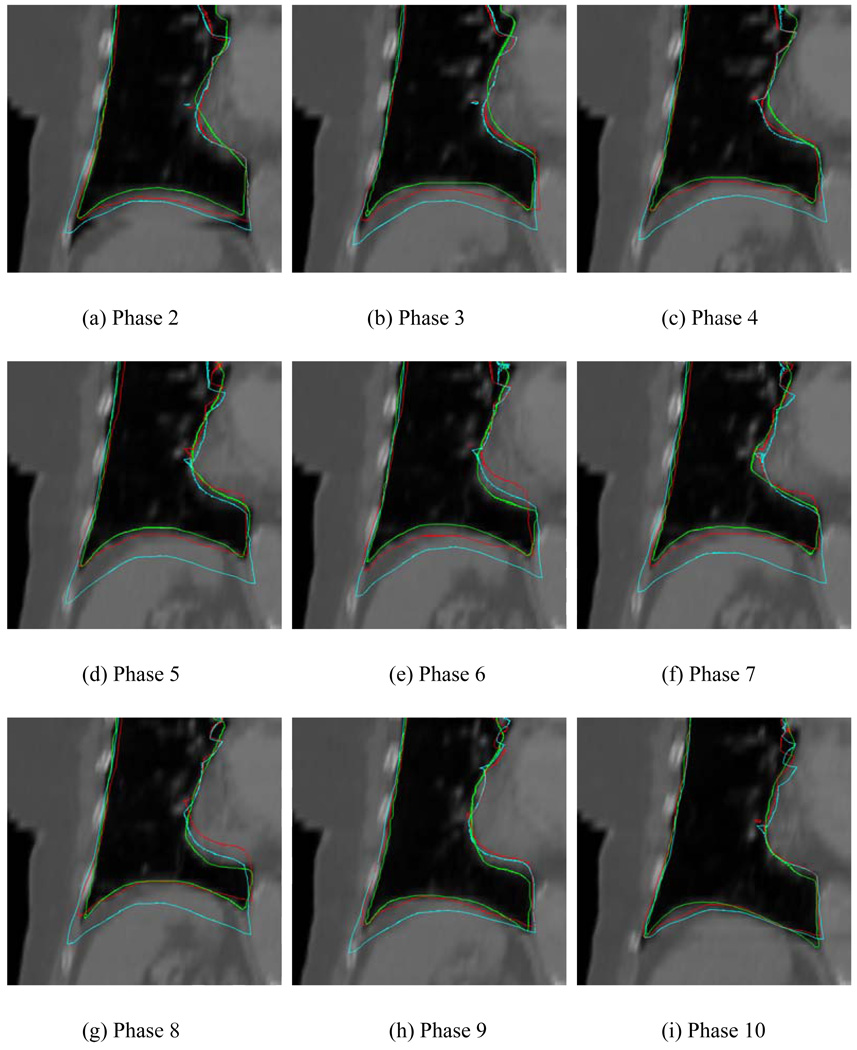
Figure 7.
Contours obtained using different methods on the target phases. The green lines represent the manually segmented contours on the target phases. The red and cyan lines represent the mapped contours derived using the proposed and conventional TPS methods, respectively. The template phase in this figure is phase 1.

