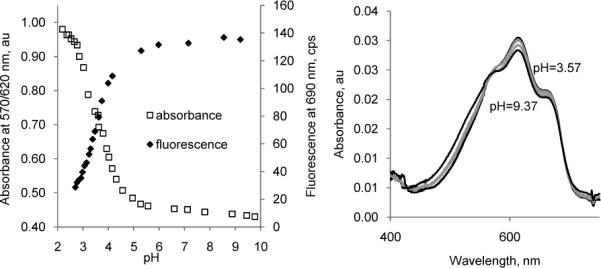
Figure 5.

Left: Titration absorption and emission intensity diagrams of 2a in water, excitation 605 nm. From absorbance: pKa = 3.58+/− 0.00, from emission: pKa = 3.53 +/− 0.02. Right: Absorption spectra for dimethylated 2c show no change between pH 3.57 and 9.37.
