Abstract
Dual polarization interferometry (DPI) and resonant mirror (RM) methods were used to characterize the growth of microtubules (MTs) on biosensor surfaces. The structure and dynamics of MTs play an important role in cell division and are a target for many anti-cancer drugs. Evidence from DPI demonstrated the growth of MTs on streptavidin-biotinylated-tubulin surfaces from the increase in mass and thickness, with a simultaneous decrease in density. The initial increase in thickness of 0.236 nm/min suggested the elongation of protofilaments before they join laterally to form the MT, where the rate of growth increased to 0.436 nm/min. Continuous mass increases were also observed when tubulin was added to a similar underlying RM surface. Tubulin binding to these surfaces was also temperature dependent, increasing the absolute response with MT stabilizers, while inhibiting binding with destabilizers when temperature was changed from 15 to 37 °C. Finally, the initial rates of tubulin assembly (mean ± SD, n=3) with MT-stabilizer agents were significantly higher at 1.50 ± 0.27 arcseconds/s and 1.04 ± 0.13 arcseconds/s, respectively, compared to 0.37 ± 0.11 arcseconds/s for tubulin containing GTP only. In the presence of the MT destabilizers, colchicine and dolastatin 10, the slopes of initial rates were lower than in their absence at 0.05 ± 0.01 arcseconds/s and 0.27 ± 0.08 arcseconds/s, respectively. This provides evidence for the ability of surface-based optical sensors to distinguish between MT stabilizers and destabilizers, while also paving the path to develop other methods to screen for MT-perturbing agents using the same underlying surface engineering.
Keywords: Dual Polarization Interferometry, Resonant Mirror, Tubulin, Microtubules
1. Introduction
Biosensors have many applications in solving biological problems from macromolecular interactions (Lillis et al., 2006) to the binding of small molecules to surfaces and immobilized large molecules (Karlsson, 2004; Boozer et al., 2006). There are several types of instruments available that use different detection methods, each possessing their own advantages and disadvantages. Dual polarization interferometry (DPI) is a technique that utilizes a waveguide structure to detect changes on a sensing layer in real time. The waveguide consists of dielectric reference and sensing layers separated by a layer of cladding in such a manner that mimics Young’s 2-slit experiment in optics (Cross et al., 2004). Light from a laser passes through the sandwiched waveguide structure and an interference pattern is detected on the opposing side by a camera. Any changes in refractive index that take place on the sensing layer alter the phase position of the fringes detected in real time, relative to the reference channel (Cross et al., 2004). Unlike the widely known surface plasmon resonance (SPR) technique, which utilizes only the transverse magnetic (TM) polarization of light, DPI takes advantage of measuring both the TM and transverse electric (TE) polarizations (Cross et al., 2004; Swann et al., 2004). Since there is only one unique solution that satisfies both the TM and TE when solving Maxwell’s equations of electromagnetism, the final outcome is an effective refractive index and thickness (with precision on the order of 0.01 nm) (Cross et al., 2004), rather than relative values. Consequently, mass and density can be calculated for the layer throughout the experiment. This type of detailed information can be very helpful during the characterization of conformational changes during protein-small molecule interactions (Swann et al., 2003) and the design of surfaces for optical biosensors (Popplewell et al., 2009).
The resonant mirror (RM) method is similar to the SPR technique, but RM waveguide structures are capable of producing sharper resonance peaks than SPR and therefore enhance sensitivity (Lukosz, 1991). This is achieved by replacing the metal layer used in SPR with a high-index dielectric resonant layer. As light passes through a prism to a low-index medium it couples with the high-index resonant layer, thereby allowing total internal reflection to occur at the boundary of the sensing layer. Resonance occurs only when the angle of the incident light and the resonant modes in the high-index layer are phase-matched. Any change in the refractive index (density) of the biological layer at the surface corresponds to a change in the angle of light that satisfies this resonance condition (Nellen and Lukosz, 1991; Cush et al., 1993). Although DPI provides more detailed information of samples on the sensing surface, its current flow-through configuration consumes a much larger amount of sample in comparison with RM’s small volume (microliter) cuvette. The RM cuvettes are also re-usable for multiple experiments.
Tubulin in its soluble form is a heterodimer of tightly bound α and β isotypes (Burns, 1991). Each isotype is a globular protein with molecular weight of ca. 50 kDa. The α subunit binds guanosine triphosphate (GTP) in a non-exchangeable manner, while GTP bound to the β subunit can hydrolyze to guanosine diphosphate (GDP) (MacNeil and Purich, 1978). Tubulin heterodimers assemble vertically to form protofilaments. Approximately 13 protofilaments join laterally in a three-start left-handed helix to form a hollow tube, the microtubule (MT) (Wade and Chretien, 1993). The presence of GTP plays an important role in the stability of the MT; heterodimers bound to GDP tend to make MTs unstable and, therefore, prone to disassembly (MacNeil and Purich, 1978). MTs provide cells with a scaffold for signaling proteins, as well as a railway for molecular motor proteins to perform their trafficking duties. MTs are also an essential component of the mitotic spindle, the apparatus that segregates sister chromatid pairs during cell division (Jordan and Wilson, 1998). These roles are a function of microtubule dynamics (Saxton et al., 1984), the relative rates of assembly and disassembly at both the plus and minus ends of the MTs. Increased MT dynamics is a hallmark of cancer cells (Jordan and Wilson, 2004). There are many MT-stabilizing and - destabilizing drugs that have been demonstrated to suppress cancer growth and cause cell death (Jordan and Wilson, 2004). For example, paclitaxel (Taxol®), a known natural product anti-cancer drug, has been demonstrated to stabilize MTs (Kumar, 1981), even in the absence of GTP (Howard and Timasheff, 1998). Epothilone B is another natural product that stabilizes MTs (Hamel, 2003), while other products such as dolastatin 10 (Hamel, 1992) and colchicines (Bhattacharyya, 2008) have a negative effect on MTs by destabilizing their formation. As many of the current antimicrotubule drugs have undesired toxicities, and/or cancer cells may become resistant to such drugs by increasing expression of multidrug resistance-associated proteins (Drukman and Kavallaris, 2002), it is, therefore, critical to screen for other agents, their analogs, and mixtures of agents that perturb MTs, but with fewer undesired toxicities. The structural changes that take place upon binding of MT-perturbing agents to tubulin vary with the type and location of tubulin binding (Sackett, 1995). An important step towards understanding the mechanism of such compounds depends on detecting the structural changes that take place upon binding. The ability to grow MTs on surfaces is also an important step in the development of high throughput (e.g., microtiter plate-based or microarray) assays to monitor MT polymerization in the presence of various de-/stabilizer agents. We report a novel method to polymerize MTs on biosensor surfaces and demonstrate the ability to distinguish the interaction of stabilizers from destabilizers on MTs using a combination of RM and DPI, a major advance on previous work where the binding of MT inhibitors to tubulin immobilized onto SPR surfaces has been reported (Aoyama et al., 2007).
2. Materials and Methods
2.1 Tubulin Biotinylation
Tubulin, purified from bovine brain to electrophoretic homogeneity (Hamel and Lin, 1984), was biotinylated with 20-fold molar excess (50 mM) NHS-LC-biotin (Pierce, Chester, UK) diluted in dimethylsulfoxide (DMSO) (Sigma, UK) following the manufacturer’s procedures in 0.1 M 2-(N-morpholino)ethanesulfonic acid (MES) (USB, Affymetrix, Inc., USA) (pH 6.9). Samples were then incubated on ice in a cold room for 2 h. Unreacted biotin was removed by centrifugation in a 30 kDa Nanosep (PALL Corp., Portsmouth, Hants, UK) microcentrifuge tube four times for 4 min at 5000 × g and 4 °C using a Jouan BR4i AB-2.14 rotor, washing the sample with 0.1 M MES buffer after each spin. The sample was then collected and stored at −80 °C. The concentration of the biotinylated protein was determined with a bicinchoninic acid protein assay kit (Sigma, USA).
2.2 in Vitro Microtubule Polymerization Assay
MT polymerization was measured by the change in absorbance of the solution at 340 nm with a SpectraMax® M5 Microplate Reader (MDS Analytical Devices (US) Inc., Sunnyvale, California). Tubulin (or biotinylated-tubulin) (1 mg/mL) in 1 M monosodium glutamate (MSG) (USB, Affymetrix, Inc., USA) (pH 6.6) with GTP (USB, Affymetrix, Inc., USA) hereafter denoted as sample buffer, at 37 °C was used, and positive and negative controls included 10 µM paclitaxel and colchicine, respectively.
2.3 Functionalization of Sensor Surfaces
Dual Polarization Interferometry Biosensor
The AnaLight® instrument (Farfield Group Ltd, Crewe, UK) was used for these experiments. NHS-LC-biotin (Pierce, Chester, UK) (200 mM in DMSO) was dropped onto the channels of an Amine Anachip™ (Farfield Group Ltd, Crewe, UK) ex situ for 10 min. The channels were then rinsed with deionized water before inserting into the chip manifold. With 0.1 M MES (pH 6.9) as the running buffer, the chip was calibrated with 4:1 ethanol-water (w/w) injections, as described (Swann et al., 2003), with the instrument set at 37 °C. Streptavidin was injected at 35 µL/min for 4 min followed by an injection of biotinylated tubulin at the same rate and time period. After each injection, the flow was returned to running buffer for a given time period so that unbound molecules were washed away and baseline was stabilized.
Resonant Mirror Biosensor
The IAsys instrument (NeoSensors, Ltd., UK) was utilized for these studies. A biotin cuvette (NeoSensors, Ltd., UK) was used as the base for the biotin-tubulin surface. The volume of sample used during all steps of the experiment was retained to 30 µL. Streptavidin (Sigma, UK) (50 µg) was added to a cuvette containing 10 mM phosphate buffer (pH 7.7) and incubated for approximately 20 min or until a response of ~2000 arcseconds was obtained (1 arcsecond = 1/3600°; 600 arcseconds corresponds to 1 ng/mm2 protein on the sensor surface). The phosphate buffer was removed from the cuvette, which was then washed and filled with 1 M MSG (pH 6.6) buffer. Approximately 50–60 µg of biotinylated tubulin was added to the cuvette for 10–15 min and the bound tubulin was washed with MSG buffer. For re-use, cuvettes were stripped with 12.5 M KOH for 20 s, which removes all the bound streptavidin and rinsed before a new layer of streptavidin was formed.
2.4 Microtubule Polymerization on surfaces
Dual Polarization Interferometry Biosensor
An injection of sample buffer was performed at 35 µL/min for 2 min to subtract the relative bulk shift due to MSG when the sample was injected. Tubulin (1 mg/mL) in sample buffer was then injected continuously at 35 µL/min for 45 min by replacing the standard sample loop with a 5 mL sample loop.
Resonant Mirror Biosensor
After the addition of biotinylated tubulin, the cuvette was washed with sample buffer. Approximately 70 µg of tubulin was then added to the cuvette and the change in response was monitored. When testing temperature dependence and the effect of compounds on initial rates of assembly, a mixture of sample buffer ± 10 µM of various MT stabilizers and destabilizers was added before the addition of tubulin. In one instance, tubulin was pre-incubated on ice with colchicine for 15 min before addition to the cuvette. The stirrer setting on the instrument was maintained at 70%, while the temperature was set at 37 °C.
3. Results & Discussion
3.1 Tubulin Polymerization on Surfaces
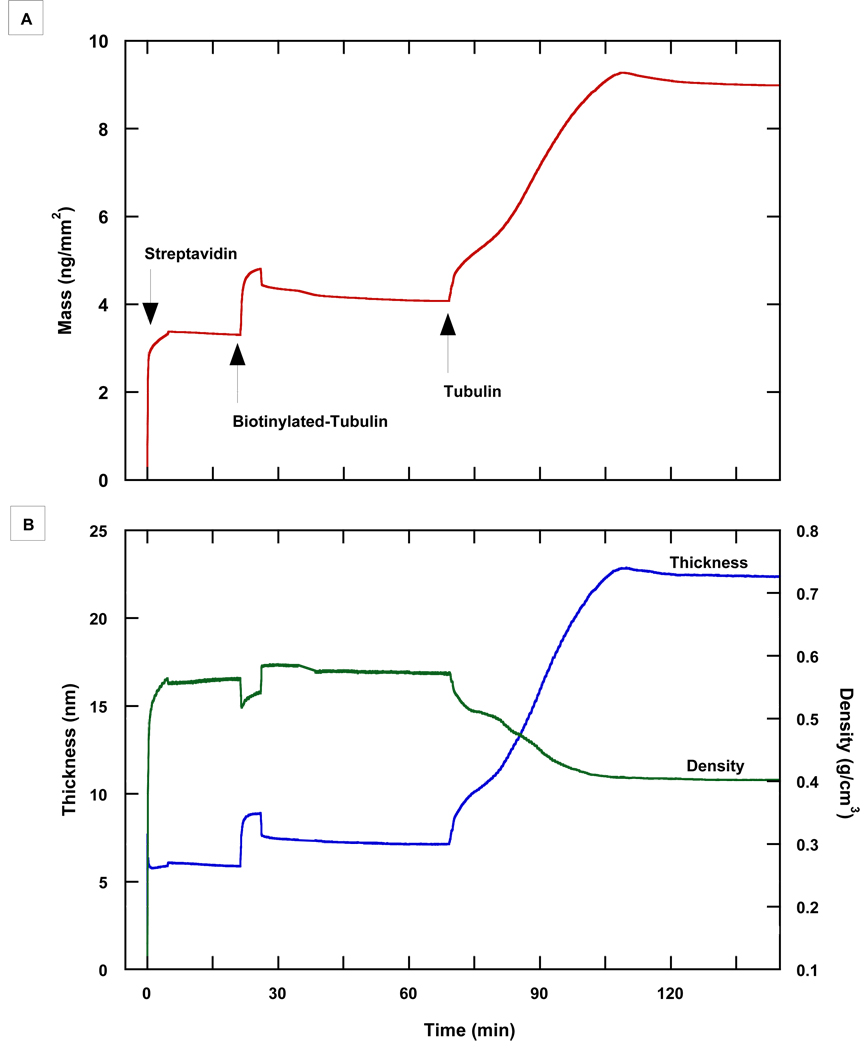
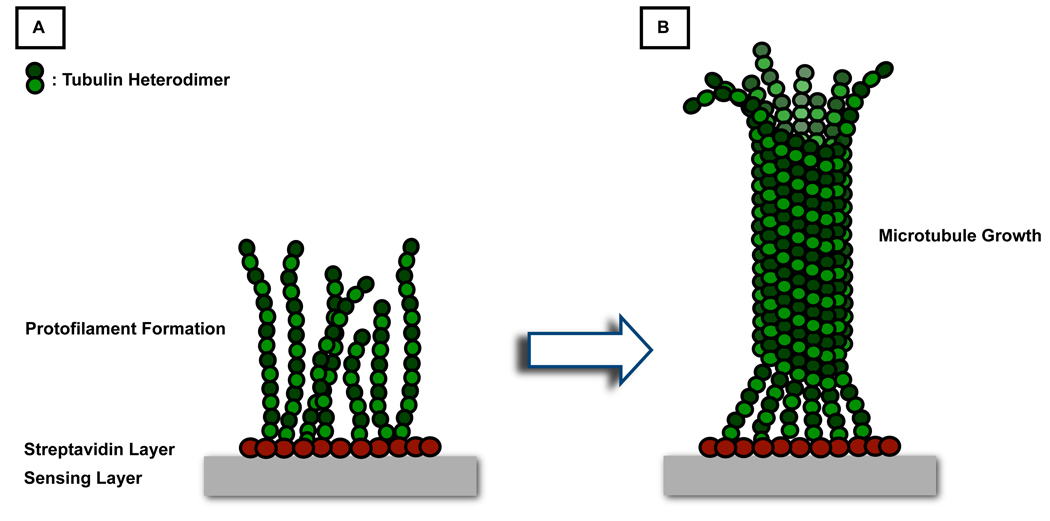
Initial attempts to immobilize tubulin directly onto non-functionalized surfaces were unsuccessful, most likely due to denaturation of the protein upon contact with the somewhat hydrophobic biosensor surfaces (Andrade and Hlady, 1986). After trials with various functionalized surfaces, biotinylated surfaces appeared to provide the best environment for a streptavidin layer followed by subsequent biotinylated tubulin and MT layers. Streptavidin deposition on a biotinylated Amine AnaChip™ formed a layer with a mass of 3.34 ng/mm2, thickness of 5.94 nm and a density of 0.56 g/cm3, consistent with previously obtained values and the dimensions of streptavidin derived from X-ray crystallography (Swann et al., 2003). The addition of biotinylated tubulin caused mass and thickness to increase to 4.12 ng/mm2 and 7.18 nm, respectively, accompanied by an increase in density to 0.57(5) g/cm3, which indicates binding of biotinylated tubulin to the streptavidin surface (Fig. 1). The increase in thickness above the streptavidin layer was only 1.24 nm, rather than the size of a tubulin heterodimer (~8 nm), accompanied by a slight increase of 0.01 g/cm3 in the density. The small increase in mass (molar ratio of biotinylated tubulin to streptavidin of 1:7) suggested that the layer of tubulin formed may not be optically homogeneous, since it corresponds to a surface coverage by biotinylated tubulin of the order of 12%, compared to 35% coverage for streptavidin (Swann et al, 2004). The initial binding of biotinylated-tubulin to the streptavidin was rapid, however, which suggested the association of biotinylated-tubulin to streptavidin to be specific, while the increase in density indicated that other processes occurred simultaneously. Thus, an alternative, but not mutually exclusive explanation is that, since tubulin has many exposed lysine residues, biotin may occupy multiple positions on the heterodimer and at various locations throughout, resulting in a number of different orientations of biotinylated-tubulin bound to streptavidin. For example, heterodimers that lie on their sides might fill any gaps between streptavidin molecules, accounting for the small thickness and density increase. Other orientations are likely to either promote or block subsequent binding of heterodimers to the surface depending on its surrounding environment. Nonetheless, the immobilized biotinylated-tubulin was sufficient to provide a starting point for MT growth. Any unbound biotinylated-tubulin was then washed away when the injection was complete and flow returned to running buffer. The subsequent introduction of tubulin in sample buffer caused a significant increase in mass and thickness reaching up to 22.85 nm with a continuous decrease in density to 0.40 g/cm3. The increase in thickness provided evidence that MTs were growing vertically on the surface, while the decrease in density is in accord with the formation of hollow MTs that are quite sparse, rather than continuous layering of tubulin dimers onto the surface. The first 10 min of the process may represent the initial nucleation and elongation process of protofilaments at a rate of 0.236 nm/min before an inflection point, where the extended protofilaments join together laterally to form the microtubule and the growth process accelerated to 0.436 nm/min (Fig. 2). Microtubule growth was halted in instances where the tubulin flow was decreased or stopped for an incubation, which reflects the need for mixing to take place near the surface. In a flow system, which is limited by the properties of laminar flow, mixing can only occur by flowing the sample relatively rapidly. We also attempted to clean DPI chips for re-use with various surfactant cleaners, sodium dodecyl sulfate, ethanol/acetone, etc., all while sonicating the chips followed by rinsing with deionized water. When chips were placed back into the instrument, however, the fringes had very low contrast and baseline signal was not stable enough to perform an experiment. Other harsher methods that etch the surface could be used, but may require the reintroduction of amine functional groups onto the chip surface before use.
Figure 1.
Resolved mass, thickness, and density of tubulin assembly as assessed with DPI. (A) The increase in mass when streptavidin, biotinylated-tubulin, and tubulin were added indicated specific binding to each of the underlying layers (B) The increase in thickness with decreasing density after the addition of tubulin to biotinylated tubulin suggested the formation of MTs on the surface.
Figure 2.
(A) Schematic representation of the formation of a uniform streptavidin layer on a biotin chip followed by the growth of tubulin protofilaments on biotinylated tubulin. (B) As protofilaments continue to grow in length, they join laterally to form MTs.
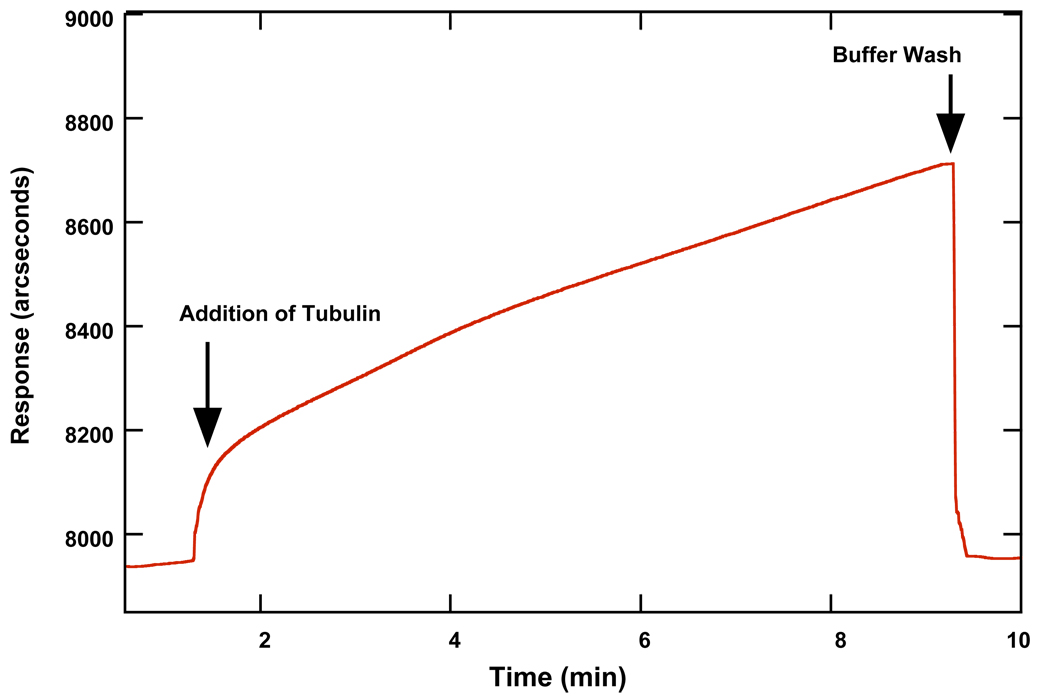
Once MT polymerization was established on such surfaces using data from DPI, the assembly of MTs was evaluated using the RM cuvette system in an effort to establish a technique that conserves sample, is more user-friendly and applicable to larger sampling sets. The addition of soluble tubulin to a biotinylated-tubulin-streptavidin RM surface containing sample buffer at 37 °C caused a bulk shift over the first 5 s, followed by a continuous increase in response (Fig. 3), corresponding to an increase in mass at the surface. In other attempts to assemble MTs on the surface, the addition of GTP after tubulin caused the increase in response to halt, possibly due to the polymerization of tubulin in solution rather than on the surface. We envision that the presence of a high concentration of GTP near the surface of the cuvette and the biotinylated tubulin allows for the tubulin to diffuse towards and bind to the surface. There were also occasional “bursts” of sudden increase in response that were observed (Fig. 3), suggesting periods of increased assembly and disassembly events. The return of response back to baseline after a buffer wash indicates the removal of the polymerized tubulin layer rather than the underlying biotinylated tubulin layer. Tubulin polymerization on such surfaces was reproducible over several (~20) cycles, but activity was lost once the surface was left at room temperature overnight or at 4 °C.
Figure 3.
Binding profile of tubulin to a biotinylated tubulin surface in 1 M MSG buffer (pH 6.6) with GTP at 37 °C using the RM biosensor. The response continuously increases until a buffer wash is performed and the process repeated.
3.2 Temperature Dependent Polymerization
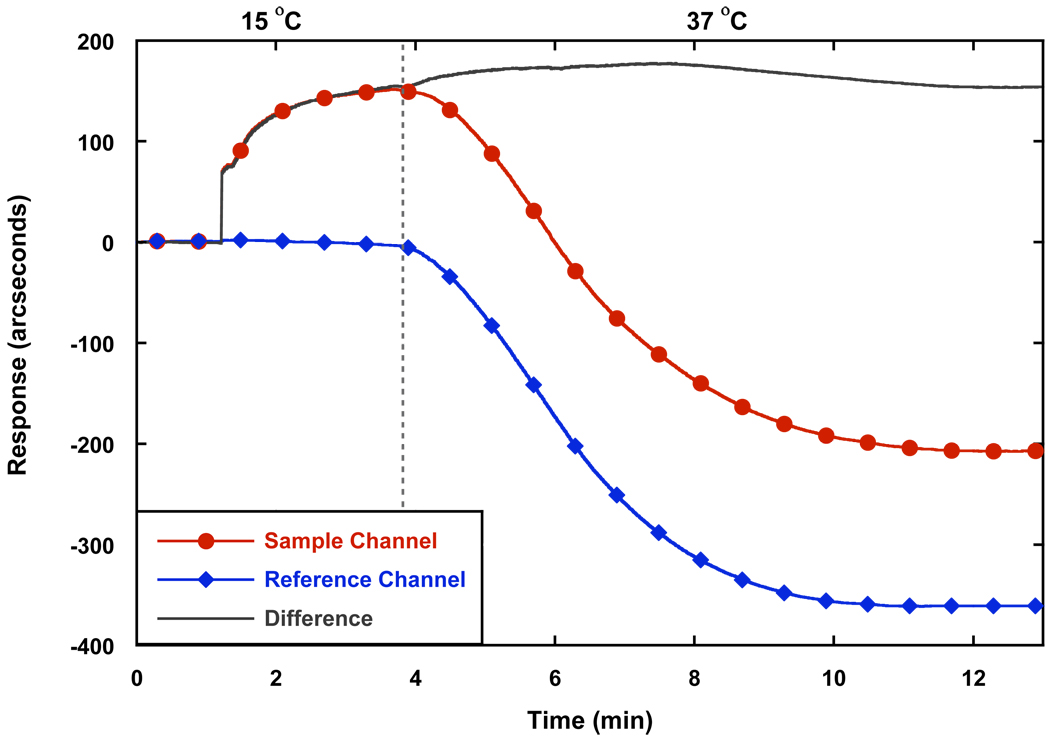
A key feature of tubulin polymerization is its temperature dependence (Hamel, 2003), with the ordered assembly of mammalian tubulin occurring optimally at 37 °C, while cold temperatures tend to destabilize MTs. Turbidimetry, most commonly used to measure MT polymerization and the influence of test agents on tubulin/MT dynamics (Hamel, 2003; Hall and Minton, 2005), is typically started at 0 °C to 4 °C and the change in absorbance is recorded while increasing the temperature to ≥ 26 °C (typically 30 °C or 37 °C) and subsequently dropping the temperature back to 4 °C to determine the stability of the MTs. The temperature dependence of tubulin polymerization was tested on the RM surface to demonstrate the functionality of tubulin on biosensor surfaces. Due to fogging of the optical system, the lowest temperature achievable on the system was 15 °C, which is still an acceptable starting point for soluble (unpolymerized) tubulin, since normal polymerization does not take place at temperatures below 15 °C (Olmsted and Borisy, 1973). Since refractive index is also temperature-dependent (Grassi and Georgiadis, 1999), the response from a separate channel (reference channel) containing only sample buffer was subtracted from the sample channel to obtain the absolute change in response upon temperature change. The binding of tubulin to the surface at 15 °C was a slow process (Fig. 4) and reached a plateau with a lower response rather than exhibiting the continuously increasing response observed at 37°C (Fig. 3). The lower response of tubulin binding at 15 °C was most likely due to the lower affinity of heterodimer association at such temperatures. Once temperature was increased to 37 °C, the absolute change in response increased, suggesting increased binding to the surface. It is worth mentioning that the change in response (Fig. 4) does not correspond to the observations from (Fig. 3) most likely due to the preference of tubulin to polymerize in solution rather than on the surface with such conditions. MT polymerization in solution most likely occurs in both situations due to the constant collisions of tubulin heterodimers and protofilaments with each other. We speculate the difference in the amount of solution polymerization is a result of Fick’s law of diffusion; at lower temperatures, mass transfer of the macromolecules to the surface is decreased due to the increased viscosity of the solution (Seeton, 2006). As a result, there is less protofilament seeding occurring near the surface at 15 °C and polymerization in solution becomes more favorable once temperature is increased. When tubulin is introduced at 37 °C, mass transfer of the tubulin to the surface is greater and the current temperature allows for binding to biotinylated tubulin and further MT polymerization onto the surface. Previous SPR studies have also indicated that binding association constants of antigen-antibody interactions are greater when temperature is increased (Zeder-Lutz et al., 1997), supporting the argument that increased mass transfer at higher temperatures affects the rate of interactions at a surface.
Figure 4.
Temperature dependence of tubulin binding to biotinylated tubulin using the RM biosensor. “Sample Channel” represents the observed response of the instrument upon the addition of tubulin to a biotinylated tubulin surface at 15 °C followed by an increase in temperature to 37 °C, where the dotted line indicates the start of temperature change. “Reference Channel” represents the change in response due to the change in temperature. “Difference” represents the subtraction of “Reference Channel” from the “Sample Channel” to give the absolute change in response due to the change in temperature.
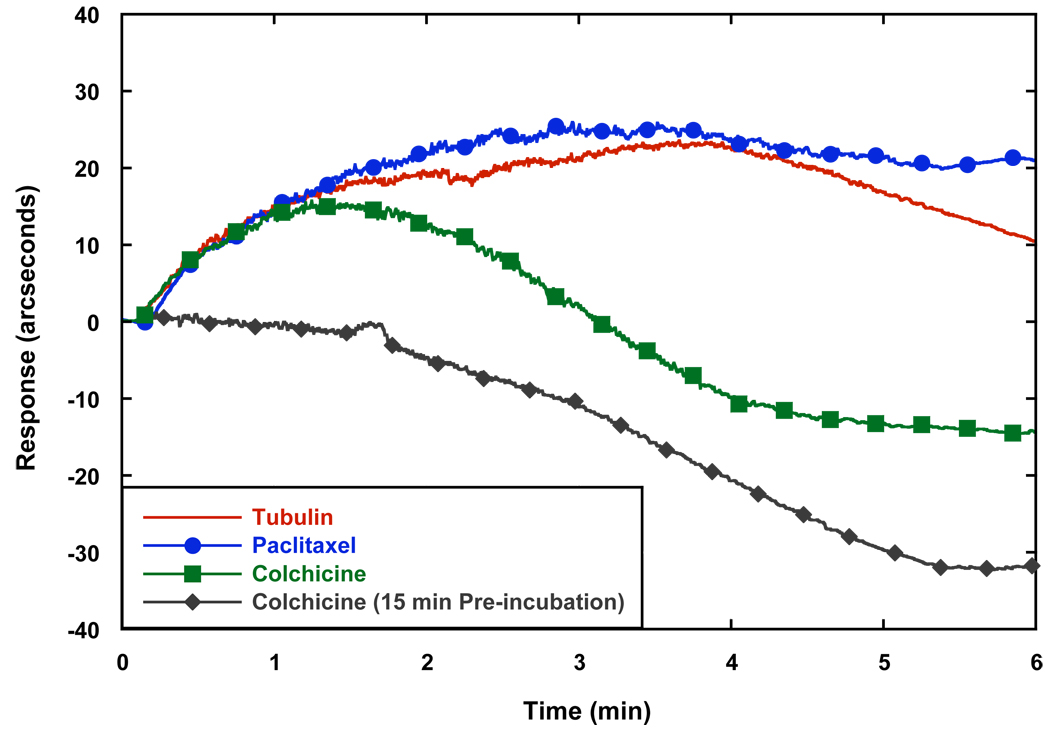
In an effort to evaluate the effect of stabilizers and destabilizers on the binding of tubulin to biotinylated-tubulin surfaces, either paclitaxel or colchicine, respectively were introduced to the mixture. When paclitaxel was added to the cuvette before the addition of tubulin, a similar binding profile was observed, even after the temperature change (Fig. 5). The binding response was also generally more stable to subsequent decreases in absolute response observed after a few minutes with tubulin alone, which most likely represent events of MT disassembly. Colchicine had a delayed inhibition effect when added before tubulin, in all likelihood due to its slow association rate with tubulin (Banerjee et al., 1997), since it completely inhibited binding when pre-incubated with tubulin on ice for 15 min prior to the addition of the tubulin to the cuvette. This provides further evidence that microtubules bound to the surface are functional and exhibit similar characteristics as those in solution.
Figure 5.
The absolute change in response starting from the time of temperature change from 15 to 37 °C. Paclitaxel addition gave a similar response to tubulin with GTP, but remained more stable from MT disassembly afterwards. Colchicine caused a decrease in the response, after an initial increase in response, but completely inhibited binding when it was pre-incubated with tubulin.
3.3 Comparison of MT-perturbing Compounds
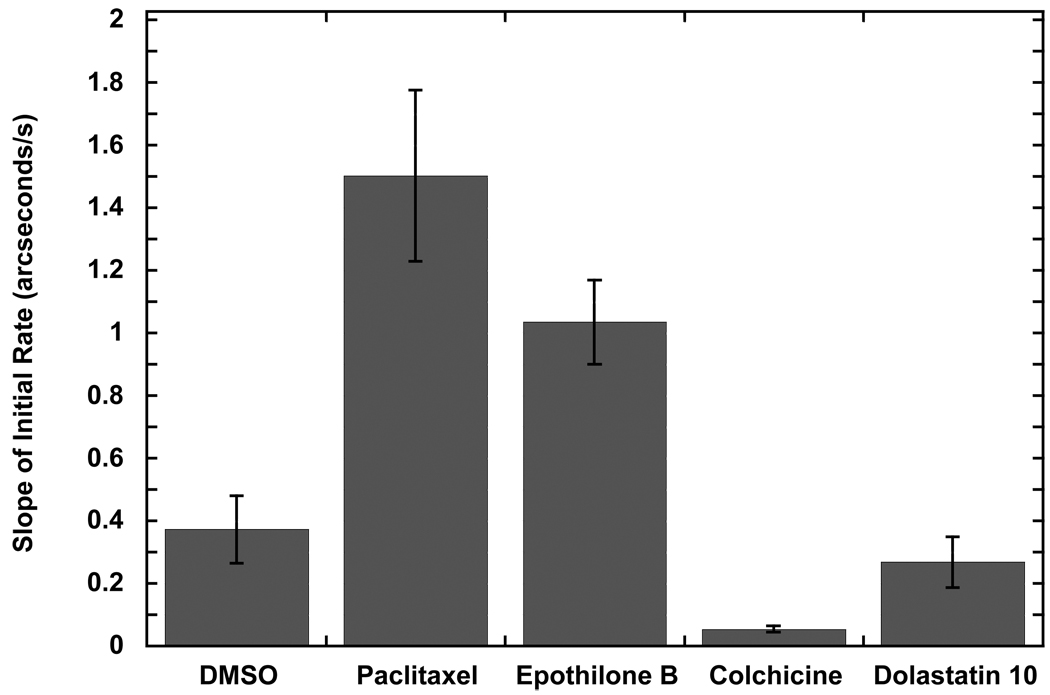
The binding profile of microtubule polymerization generally did not fit well to mono- or bi-phasic binding profiles upon analysis with Fastfit Software (NeoSensors, Ltd., UK). This is not surprising, given the complexity of MT polymerization (Hall and Minton, 2005), which involves many processes, such as GTP binding and hydrolysis, as well as constant assembly and disassembly events (Jordan and Wilson, 2004). The most consistent parameter that describes interactions of tubulin with various agents appears to be the slopes of initial rates of assembly; the change in response during the first 15 s after tubulin is added (allowing for a 5 s mixing time during the bulk shift). These values appear to provide a means to evaluate the polymerization process in the presence of various de-/stabilizer agents. When paclitaxel and epothilone B, both MT stabilizers, were introduced to the system, the slopes of initial rates (mean ± SD, n=3) were significantly higher at 1.50 ± 0.27 arcseconds/s and 1.04 ± 0.13 arcseconds/s, respectively, compared to 0.37 ± 0.11 arcseconds/s for tubulin containing GTP only (Fig. 6). This is expected given tubulin in the presence of paclitaxel polymerizes at a faster rate than in the presence of epothilone B (Gertsch et al., 2009). In the presence of MT destabilizers such as colchicine and dolastatin 10, the slopes of initial rates were lower than in their absence at 0.05 ± 0.01 arcseconds/s and 0.27 ± 0.08 arcseconds/s, respectively. Thus, the present approach provides a means for a screening, differentiating compounds acting as stabilizers from those that are destabilizers based on the slopes of initial rates.
Figure 6.
Comparison of the slopes of initial rates of MT assembly with various MT-perturbing agents. Paclitaxel and epothilone B, both MT stabilizers, exhibited greater slopes of initial rates in comparison with the DMSO control. MT destabilizers, colchicine and dolastatin, gave lower values than the control. Values are reported as a mean with n=3 and the error bars representing the standard deviation. The pair-wise P values in comparison with the tubulin control were 0.035, 0.005, 0.033, and 0.838 for paclitaxel, epothilone B, colchicine, and dolastatin 10, respectively.
4. Conclusions
Characterizing the effects of MT-perturbing agents on the dynamics and stability of MTs is an important step to identify effective anti-cancer drugs. The detailed information of mass, thickness, and density of protein layers provided by DPI indicated the formation of MTs after an initial nucleation process over a streptavidin-biotinylated tubulin surface. The formation of MTs was also evaluated by RM using a cuvette-based system that consumes less protein sample and is more applicable for sampling larger sets of compounds. The temperature dependence of tubulin assembly with various MT de-/stabilizers agreed well with previously obtained turbidimetric results. Finally, the initial rates of tubulin assembly with MT de-/stabilizers provided a possible parameter to distinguish MT stabilizers from destabilizers. We envision future work to include, in addition to the measurement of initial rates using optical biosensors, the formation of MTs on surfaces of microtiter plates based on the methods described above and applying other types of high-throughput screening techniques such as fluorescence arrays to screen libraries of MT-perturbing agents.
Acknowledgements
This work was funded by a European Union Marie Curie Early Stage Training Fund Fellowship (HND), the North West Cancer Research Fund (DGF), the Cancer and Polio Research Fund (DGF), and the National Institutes of Health (CA078039 grant) (BWD). We would also like to thank Drs. Neville Freeman, Mark Gostock, Jonathan Popplewell, and Marcus Swann from Farfield Group, Ltd. for their technical support and stimulating discussions.
Footnotes
Publisher's Disclaimer: This is a PDF file of an unedited manuscript that has been accepted for publication. As a service to our customers we are providing this early version of the manuscript. The manuscript will undergo copyediting, typesetting, and review of the resulting proof before it is published in its final citable form. Please note that during the production process errors may be discovered which could affect the content, and all legal disclaimers that apply to the journal pertain.
References
- Andrade JD, Hlady V. Protein adsorption and materials biocompatibility: a tutorial review and suggested hypotheses. Advances in Polymer Science. 1986;79:1–63. [Google Scholar]
- Aoyama H, Noguchi T, Misawa T, Nakamura T, Miyachi H, Hashimoto Y, Kobayashi H. Development of tubulin-polymerization inhibitors based on the thalidomide skeleton. Chemical & Pharmaceutical Bulletin. 2007;55:944–949. doi: 10.1248/cpb.55.944. [DOI] [PubMed] [Google Scholar]
- Banerjee S, Chakrabarti G, Bhattacharyya B. Colchicine binding to tubulin monomers: a mechanistic study. Biochemistry. 1997;36:5600–5606. doi: 10.1021/bi962648n. [DOI] [PubMed] [Google Scholar]
- Bhattacharyya B, Panda D, Gupta S, Banerjee M. Anti-mitotic activity of colchicine and the structural basis for its interaction with tubulin. Medicinal Research Reviews. 2008;28(1):155–183. doi: 10.1002/med.20097. [DOI] [PubMed] [Google Scholar]
- Boozer C, Kim G, Cong S, Guan H, Londergan T. Looking towards label-free biomolecular interaction analysis in a high-throughput format: a review of new surface plasmon resonance technologies. Current Opinion in Biotechnology. 2006;17(4):400–405. doi: 10.1016/j.copbio.2006.06.012. [DOI] [PubMed] [Google Scholar]
- Burns RG. Alpha-, beta-, and gamma-tubulins: sequence and structural constraints. Cell Motility and the Cytoskeleton. 1991;20(3):181–189. doi: 10.1002/cm.970200302. [DOI] [PubMed] [Google Scholar]
- Cross GH, Reeves A, Brand S, Swann MJ, Peel LL, Freeman NJ, Lu JR. The metrics of surface adsorbed small molecules on the Young’s fringe dual-slab waveguide interferometer. Journal of Physics D: Applied Physics. 2004;37:74–80. [Google Scholar]
- Cush R, Cronin JM, Stewart WJ, Maule CH, Molloy J, Goddard NJ. The resonant mirror: a novel optical biosensor for direct sensing of biomolecular interactions. Part I: Principle of operation and associated instrumentation. Biosensors and Bioelectronics. 1993;8:347–353. [Google Scholar]
- Drukman S, Kavallaris M. Microtubule alterations and resistance to tubulin-binding agents. International Journal of Oncology. 2002;21:621–628. [PubMed] [Google Scholar]
- Gertsch J, Meier S, Müller M, Altmann KH. Differential effects of natural product microtubule stabilizers on microtubule assembly: single agent and combination studies with taxol, epothilone B, and discodermolide. ChemBioChem. 2009;10(1):166–175. doi: 10.1002/cbic.200800556. [DOI] [PubMed] [Google Scholar]
- Grassi JH, Georgiadis RM. Temperature-dependent refractive index determination from critical angle measurements: Implications for quantitative SPR sensing. Analytical Chemistry. 1999;71(19):4392–4396. doi: 10.1021/ac990125q. [DOI] [PubMed] [Google Scholar]
- Hall D, Minton AP. Turbidity as a probe of tubulin polymerization kinetics: a theoretical and experimental re-evaluation. Analytical Biochemistry. 2005;345(2):198–213. doi: 10.1016/j.ab.2005.07.011. [DOI] [PubMed] [Google Scholar]
- Hamel E, Lin CM. Separation of active tubulin and microtubule-associated proteins by ultracentrifugation and isolation of a component causing the formation of microtubule bundles. Biochemistry. 1984;23:4173–4184. doi: 10.1021/bi00313a026. [DOI] [PubMed] [Google Scholar]
- Hamel E. Natural products which interact with tubulin in the Vinca domain: maytansine, rhizoxin, phomopsin A, dolastatins 10 and 15 and halichondrin B. Pharmacology and Therapeutics. 1992;55:31–51. doi: 10.1016/0163-7258(92)90028-x. [DOI] [PubMed] [Google Scholar]
- Hamel E. Evaluation of antimitotic agents by quantitative comparisons of their effects on the polymerization of purified tubulin. Cell Biochemistry and Biophysics. 2003;38:1–21. doi: 10.1385/CBB:38:1:1. [DOI] [PubMed] [Google Scholar]
- Homola J. Present and future of surface plasmon resonance biosensors. Analytical and Bioanalytical Chemistry. 2003;377:528–539. doi: 10.1007/s00216-003-2101-0. [DOI] [PubMed] [Google Scholar]
- Howard WD, Timasheff SN. Linkages between the effects of taxol, colchicine, and GTP on tubulin polymerization. Journal of Biological Chemistry. 1998;263(3):1342–1346. [PubMed] [Google Scholar]
- Jordan MA, Wilson L. Microtubules and actin filaments: dynamic targets for cancer chemotherapy. Current Opinion in Cell Biology. 1998;10:123–130. doi: 10.1016/s0955-0674(98)80095-1. [DOI] [PubMed] [Google Scholar]
- Jordan MJ, Wilson L. Microtubules as a target for anticancer drugs. Nature Reviews: Cancer. 2004;4:253–265. doi: 10.1038/nrc1317. [DOI] [PubMed] [Google Scholar]
- Karlsson R. SPR for molecular interaction analysis: a review of emerging application areas. Journal of Molecular Recognition. 2004;17(3):151–161. doi: 10.1002/jmr.660. [DOI] [PubMed] [Google Scholar]
- Kumar N. Taxol-induced polymerization of purified tubulin. Journal of Biological Chemistry. 1981;256(20):10435–10441. [PubMed] [Google Scholar]
- Lillis B, Manning M, Berney H, Hurley E, Mathewson A, Sheehan MM. Dual polarisation interferometry characterisation of DNA immobilisation and hybridisation detection on a silanised support. Biosensors and Bioelectronics. 2006;21(8):1459–1467. doi: 10.1016/j.bios.2005.06.009. [DOI] [PubMed] [Google Scholar]
- Lukosz W. Principles and sensitivities of integrated optical and surface plasmon sensors for direct affinity sensing and immunosensing. Biosensors and Bioelectronics. 1991;6:215–225. [Google Scholar]
- MacNeal RK, Purich DL. Stoichiometry and role of GTP hydrolysis in bovine neurotubule assembly. Journal of Biological Chemistry. 1978;253:4683–4687. [PubMed] [Google Scholar]
- Nellen PM, Lukosz W. Model experiments with integrated optical input grating couplers as direct immunosensors. Biosensors and Bioelectronics. 1991;6:215–225. doi: 10.1016/0956-5663(91)85049-3. [DOI] [PubMed] [Google Scholar]
- Olmsted JB, Borisy GG. Characterization of microtubule assembly in porcine brain extracts by viscometry. Biochemistry. 1973;12(21):4282–4289. doi: 10.1021/bi00745a037. [DOI] [PubMed] [Google Scholar]
- Popplewell JF, Swann MJ, Ahmed Y, Fernig DG. Fabrication of carbohydrate surfaces using nonderivatized oligosaccharides and their application to measuring the 3D assembly of sugar-protein complexes. ChemBioChem. 2009 doi: 10.1002/cbic.200800696. In Press. [DOI] [PubMed] [Google Scholar]
- Sackett DL. Vinca site agents induce structural changes in tubulin different from and antagonistic to changes induced by colchicine site agents. Biochemistry. 1995;34(21):7010–7019. doi: 10.1021/bi00021a012. [DOI] [PubMed] [Google Scholar]
- Saxton WM, Stemple DL, Leslie RJ, Salmon ED, Zavortink M, McIntosh JR. Tubulin dynamics in cultured mammalian cells. Journal of Cell Biology. 1984;99:2175–2186. doi: 10.1083/jcb.99.6.2175. [DOI] [PMC free article] [PubMed] [Google Scholar]
- Seeton CJ. Viscosity-temperature correlation for liquids. Tribology Letters. 2006;22(1):67–78. [Google Scholar]
- Swann M, Freeman N, Carrington S, Ronan G, Barrett P. Quantifying structural changes and stoichiometry of protein interactions using size and density profiling. Letters in Peptide Science. 2003;10:487–494. [Google Scholar]
- Swann MJ, Peel LL, Carrington S, Freeman NJ. Dual-polarization interferometry: an analytical technique to measure changes in protein structure in real time, to determine the stoichiometry of binding events, and to differentiate between specific and nonspecific interactions. Analytical Biochemistry. 2004;329:190–198. doi: 10.1016/j.ab.2004.02.019. [DOI] [PubMed] [Google Scholar]
- Wade RH, Chretien D. Cryoelectron microscopy of microtubules. Journal of Structural Biology. 1993;110:1–27. doi: 10.1006/jsbi.1993.1001. [DOI] [PubMed] [Google Scholar]
- Zeder-Lutz G, Zuber E, Witz J, Van Regenmortel MHV. Thermodynamic analysis of antigen-antibody binding using biosensor measurements at different temperatures. Analytical Biochemistry. 1997;246:123–132. doi: 10.1006/abio.1996.9999. [DOI] [PubMed] [Google Scholar]


