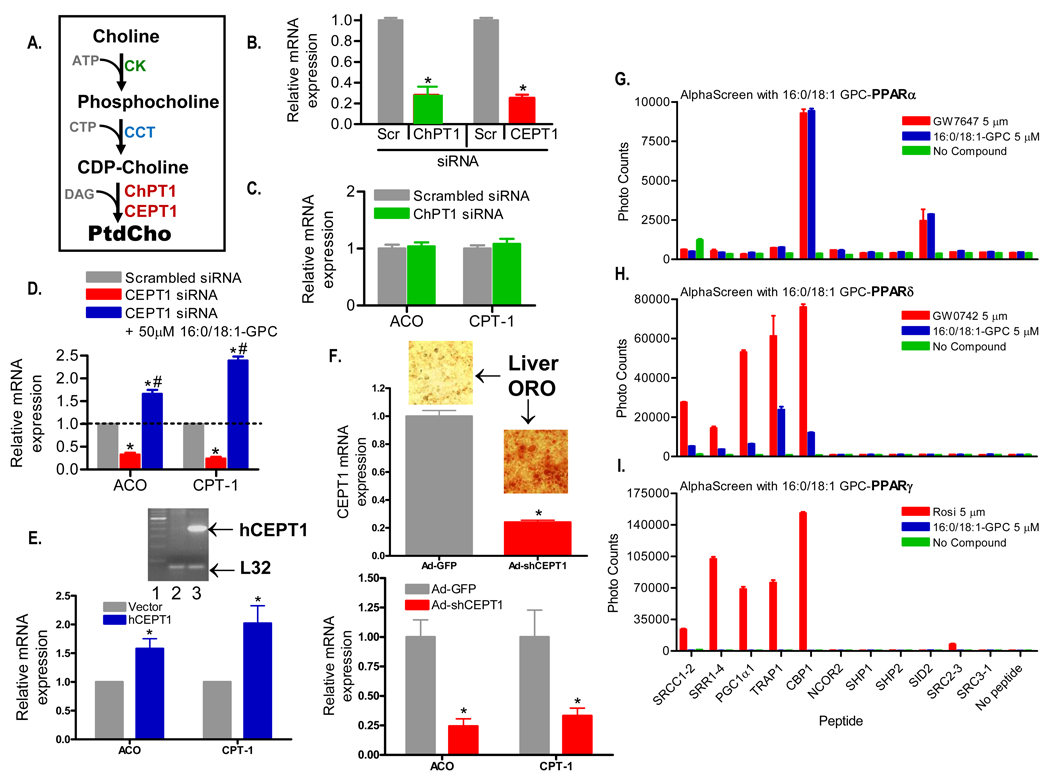
Figure 6. Gene Expression and Binding Assays.
(A) Schematic of the Kennedy pathway to generate phosphatidylcholine (PtdCho). CK, choline kinase; CTP, cytosine triphosphate; CCT, CTP phosphocholine citidyltransferase; DAG, diacyl glycerol; ChPT1, choline phosphotransferase 1; CEPT1, choline-ethanolamine phosphotransferase 1.
(B) Effect on ChPT1 and CEPT1 mRNA levels normalized to L32 ribosomal mRNA in response to 72 h treatment with corresponding siRNAs and scrambled (Scr) controls in Hepa 1–6 cells.
(C) Effect of 72 h treatment with scrambled and ChPT1 siRNAs on PPARα target genes (ACO and CPT-1) by RT-PCR normalized to L32 ribosomal mRNA in Hepa 1–6 cells.
(D) Effect of 72 h treatment with scrambled and CEPT1 siRNAs on ACO and CPT-1 message levels in Hepa 1–6 cells. Expression of ACO and CPT-1 was also assessed 24 h after addition of 50 µM 16:0/18:1-GPC in a subset of Hepa 1–6 cells previously treated with CEPT1 siRNA. mRNA levels are normalized to control L32 ribosomal mRNA. For C–E, graphs represent mean ± SEM of three separate experiments with each group in triplicate. *, P < 0.05 compared to scrambled controls. #, P < 0.05 compared to CEPT1 siRNA treated cells.
(E) Effect of CEPT1 overexpression on ACO and CPT-1 message levels in Hepa 1–6 cells. Cells were transfected with a human CEPT1 expression vector, and expression was documented by the RT-PCR reaction shown in the inset (lane 1-ladder, lane 2-cells transfected with empty vector, lane 3-cells transfected with the human CEPT1 vector). Graphical results are normalized to L32 mRNA. *, P < 0.05 compared to vector.
(F) Effect of CEPT1 knockdown in living mice. C57BL/6 mice were treated with an shRNA adenovirus for CEPT1 or a control virus expressing GFP. shRNA treatment resulted in decreased expression of CEPT1 (top panel) and livers showed increased staining by Oil Red O (ORO). shRNA-treated livers also showed decreased expression of ACO and CPT-1 (bottom panel). Results are normalized to L32. *, P < 0.05 compared to GFP treatment.
(G–I) Binding of various peptide motifs to the purified PPARα (G), PPARδ (H), and PPARγ (I) LBD in the presence of 5 µM of the corresponding PPAR agonist or 16:0/18:1-GPC as measured by AlphaScreen assays. The background signals of either the respective LBDs or the peptides alone, or without addition of the ligand/agonist (no compound), are all less than 800. Data represent mean ± SEM from three separate experiments.

