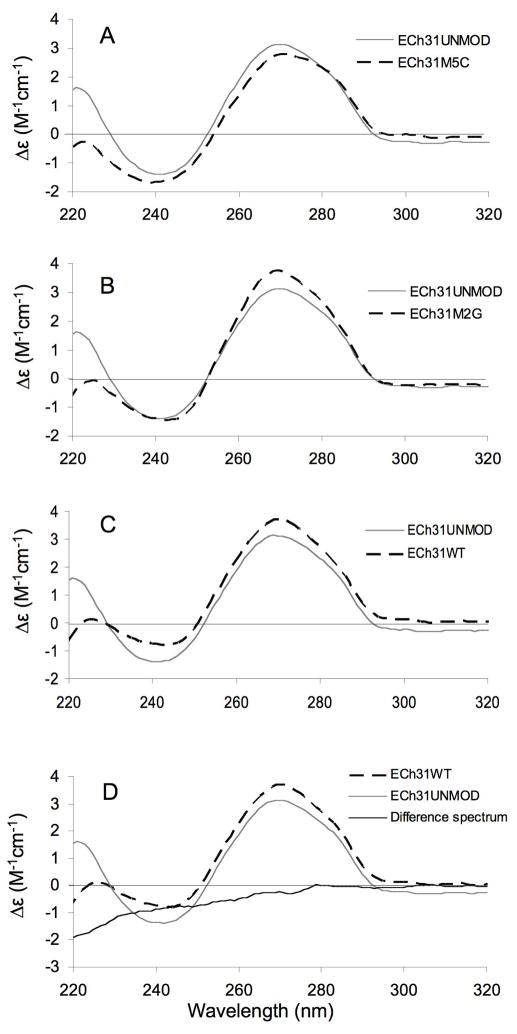
Figure 3.
CD spectra of the modified and unmodified RNA constructs are shown. Each spectrum is an average of five scans. The CD spectrum of the unmodified analogue (ECh31UNMOD, solid grey line) is shown in panels A–C with overlays (dashed lines) of the ECh31M5C (A), ECh31M2G (B), and ECh31WT (C) RNAs. The molar ellipticities are normalized to RNA concentrations. The total difference spectrum (ECh31M5C + ECh31M2G − ECh31UNMOD − ECh31WT) is shown in panel D (solid black line).

