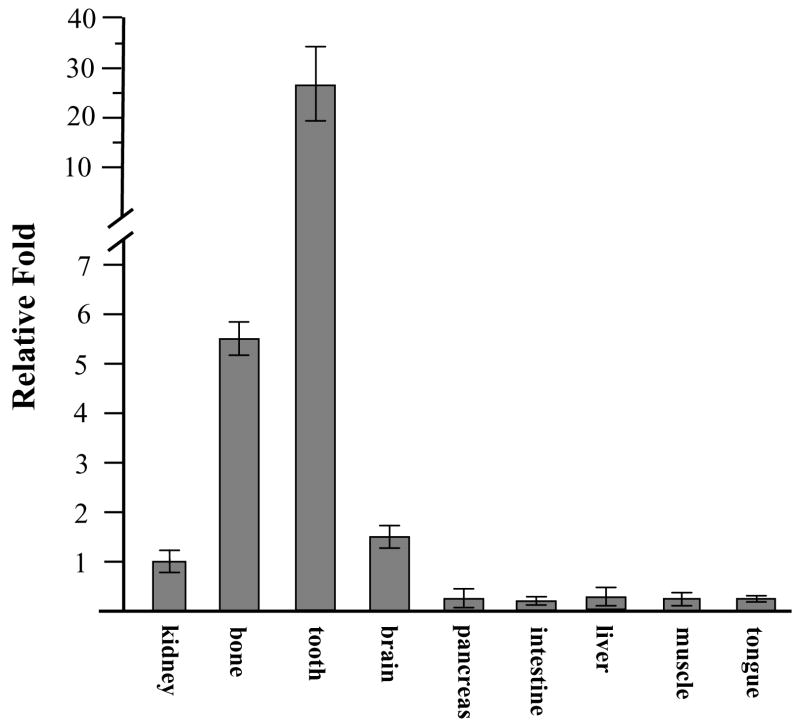
Fig. 1. Expression of the mouse DSPP mRNA by qRT-PCR.
Total RNAs from various tissues were isolated and reversely transcribed. Quantitative RT-PCR was used to measure DSPP mRNA expression from different tissues described as above. Value was obtained from ratio between DSPP and S18 expression. The value from kidney group was taken as a 1.0-fold increase. The relative fold value was calculated by dividing the individual value by the kidney group value. The data show the means ± S.E. from 3 separate experiments.

