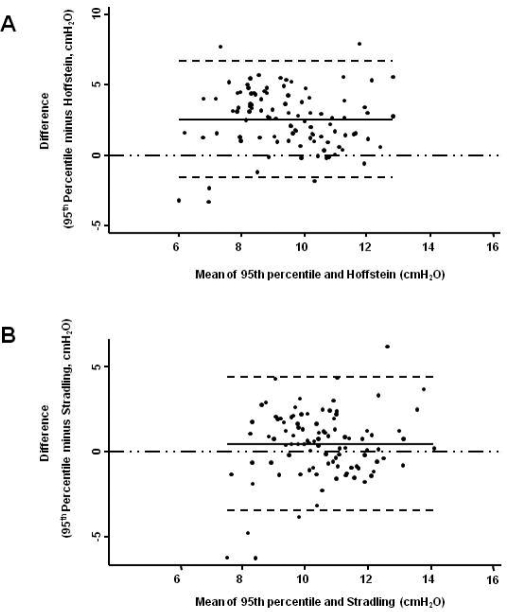
Figure 1.
Modified Bland & Altman Plots. The 95th percentile APAP was considered as the reference value. Negative figures imply that the values predicted by the equation were greater than the 95th percentile APAP. Panel A is for Hoffstein's predicted values and Panel B for Stradling's. The continuous line is the observed average agreement; dash lines are 95% limits of agreement, and y = 0 is the line of perfect average agreement.

