
Figure 3.
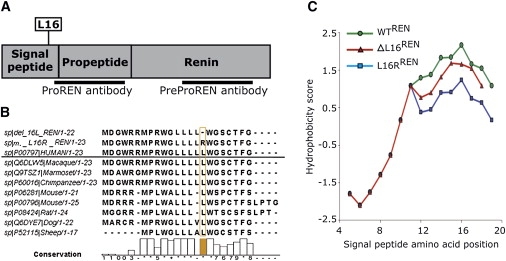
Bioinformatic Analysis of the Preprorenin
(A) Diagram of the preprorenin sequence showing the locations of the identified mutations and epitopes recognized by prorenin (amino acid residues 21–64) and preprorenin (amino acid residues 288–317) antibodies used in this study.
(B) Homology of the mutant and wild-type human preprorenin signal sequences with those of higher mammals.
(C) Hydrophobicity plot of the WTREN, ΔL16REN, and L16RREN signal sequences calculated via the Kyte and Doolittle method and scale.