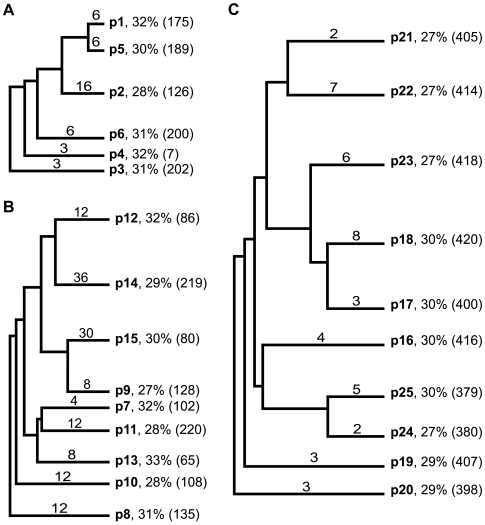
Figure 7. Cladograms of predicted EETI loop 3 clones tested for their abilities to bind trypsin.
Select predicted EETI loop 3 clones tested for binding to fluorescently-labeled trypsin are shown in their relative groups: (A) clones containing four or more common motifs, (B) clones containing three common motifs, and (C) clones least similar to those recovered from the enriched EL3-9 library. Names of the predicted clones are shown in bold. Numbers above the branch lines denote the number of other predicted clones in the same cluster as the selected clone. Percentages denote the average homology of the loop sequence of the predicted clone to those of the pool of enriched EL3-9 clones. The similarity rankings of each clone to the pool of enriched EL3-9 trypsin-binding clones, based on a modified BLOSUM62 substitution matrix, are shown in parentheses (where 1 is most similar and 420 is least similar).

