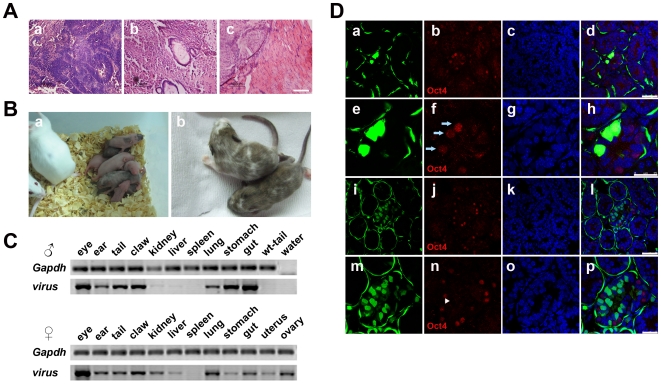
Figure 6. Differentiation of iPS cells in vivo.
(A) Teratomas were histochemically analyzed (HE staining). Typical neural rosettes (a), intestines (b) and muscles (c) were found. Scale bars are 100 µm. (B) Chimeric mice from iPS cells of line 11.1. (a) Neonatal chimeric mice, (b) two-week old chimeric mice. Black color indicates contribution of iPS cells of line 11.1. (C) Genomic DNA from various organs of two-week old male and female chimeric mice was analyzed using genomic PCR and virus-specific primers. (D) Testes of the male chimeric mouse were sliced transversely and analyzed for EGFP and Oct4 expression. The iPS cells expressing EGFP developed to spermatogonial stem cells. (a)–(d) and (i)–(l), low magnification; (e)–(h) and (m)–(p), high magnification for immunofluorescence staining of Oct4. Arrows indicate Oct4 positive and EGFP expressed spermatogonial stem cells. Arrow heads indicate Oct4 negative and EGFP expressed spermatocytes. Scale bars are 50 µm in (a)–(d) and (i)–(l), 25 µm in (e)–(h) and (m)–(p).

