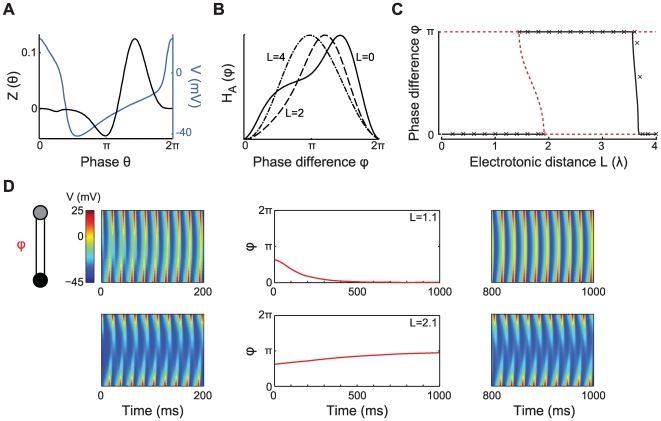
Figure 4. Phase-locking of two Morris-Lecar type II oscillators.
The oscillators (described in Methods) are coupled via a passive cable of electrotonic length  ,
,  ms. A: Voltage trajectory (blue) and phase response function (black) of the Morris-Lecar type II oscillator, period
  ms. B: Shape of
  for
for  (solid curve),
  (dashed curve) and
  (dash-dotted curve). The functions have been rescaled and aligned in order to show the different degrees of skewness. C: Bifurcation diagram showing the stable (solid black line) and unstable (dashed red line) phase-locked solutions as a function of
  . Cross marks give the stable phase difference determined with numerical simulations using
  S cm
S cm with
with  ms, and
  mV. D: The middle two panels show simulations of the phase difference dynamics (red curves) for
  (top) and
  (bottom) with
  S cm
S cm . Space-time plots of the membrane potential along the dendritic cable cable are plotted for the first 200 ms (left) and for the final 200 ms (right) of the two simulations.

