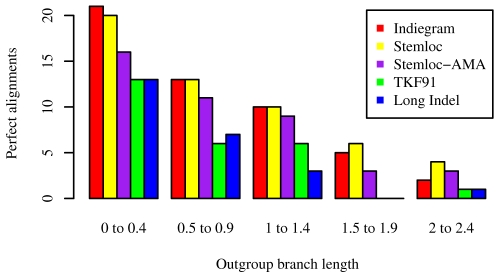
Figure 10. Dependence of perfect alignment rate on alignment method and outgroup branch length.
Perfect alignment is when a given alignment program estimates the alignment 100% correctly, with no errors. Simulating the evolution of three structural RNAs under the TKFST model, we investigated the dependency of perfect alignment rate on outgroup branch length. The simulation included two sister species at unit distance from the ancestral sequence, plus one “outgroup” whose branch length  was varied between
  by selecting 25 equally spaced values of
  in this range, spaced
  apart. (A unit-length branch here corresponds to one expected substitution per site in loop sequence.) We simulated 25 alignments for each value of
  , using TKFST model parameters described in the text. Since the perfect alignment rate is rather low, we further aggregated the
  into bins of five; thus, for example, the bin named “
 ” includes
  and represents
  trials in total. The perfect alignment rate was measured for various statistical alignment inference procedures. These procedures are described in the text, but may be summarized very briefly as ML under the true model (“Indiegram”); greedy approximate-ML progressive alignment by single-linkage clustering with pair SCFGs (“Stemloc”); sequence annealing, a form of posterior decoding to maximize a sum-over-pairs accuracy metric, using pair SCFGs to get the posterior probabilities (“Stemloc-AMA”); statistical alignment using the TKF91 model, i.e. linear gap-penalties (“TKF91”); and statistical alignment using a long-indel model, i.e. affine gap-penalties (“Long Indel”).

