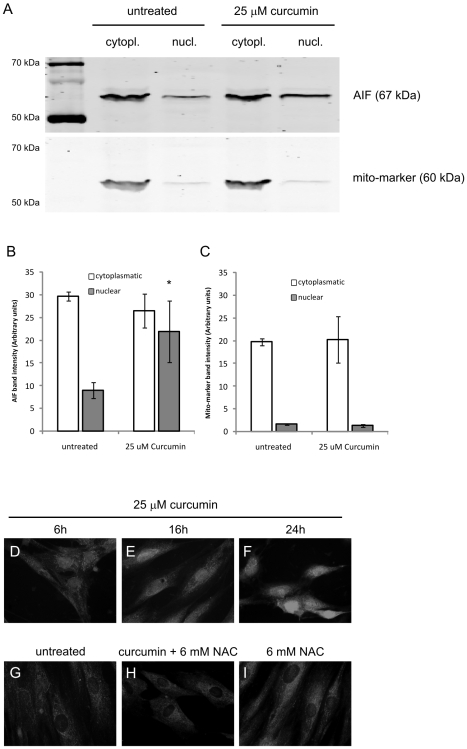
Figure 8. Curcumin Induces AIF Translocation to the Nucleus.
A–C) Cells were treated with 25 µM curcumin or were left untreated. After 24 hours cells were lysed and nuclear and cytoplasmatic proteins were isolated using a commercial kit. A) Identical protein concentrations were loaded and separated by SDS-PAGE and blotted onto nitrocellulose membranes. Blots were incubated with Abs against AIF and a mito-marker (as a control for protein separation) and the appropriate fluorescently labeled secondary Abs. The fluorescence of the specific protein bands was determined using the Odyssey Infrared Imaging System. Shown is the result of a representative of 3 independent experiments. B) Mean±SD of the band intensities of AIF from 3 independent experiments. C) Mean±SD of the band intensities of mito-marker from 3 independent experiments. D–I) Fibroblasts were seeded on diagnostic microscope slides and treated with 25 µM curcumin or were left untreated. After 24 hours, cells were fixed and permeabilized and subsequently stained using a specific Ab against AIF. Detection was done via an Alexa-488 labeled secondary Ab. D) 6 hours 25 µM curcumin, E) 16 hours 25 µM curcumin, F) 24 hours 25 µM curcumin, G) untreated cells, H) 24 hours 25 µM curcumin+6 mM NAC, I) 24 hours 6 mM NAC, * = p<0.05 compared to nuclear AIF in the untreated group.

