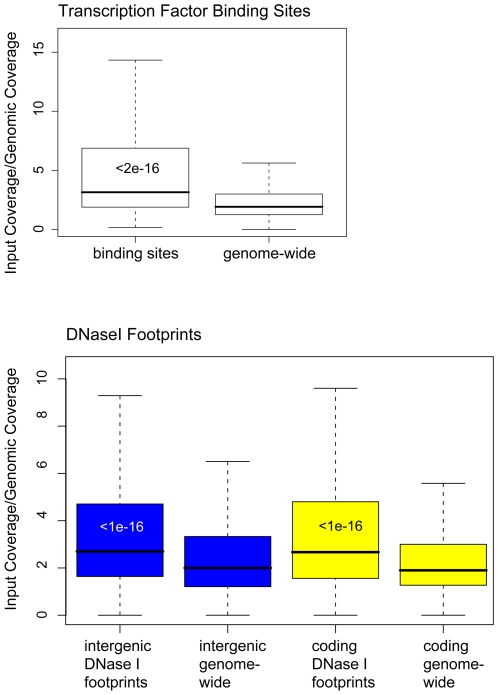
Figure 3. High input-Seq coverage across sites of protein-DNA interaction.
Boxplots of input-Seq read coverage, normalized to genomic reads. The upper panel shows the boxplots for transcription factor binding sites and genome-wide input coverage. The lower panel shows the boxplots for DNase I-resistant footprints and genome-wide distributions of input sequence coverage. In blue are the boxplots of intergenic regions and in yellow the boxplots of coding regions. Wilcoxon-Mann-Whitney p-values, comparing input coverage distributions of binding sites or DNase I-footprinted site to genome-wide DNA, are shown within the boxplots.

