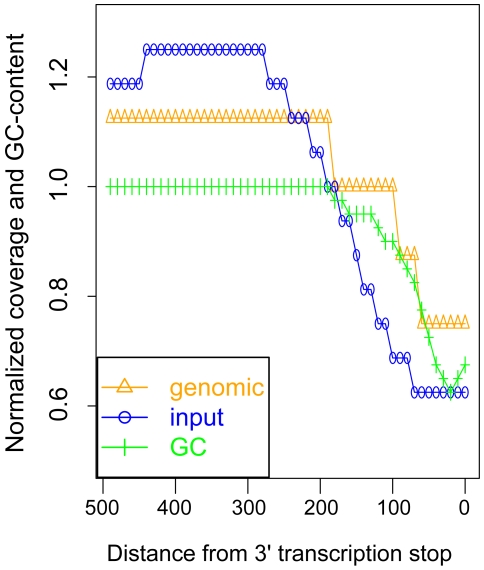
Figure 8. GC-content and sequence read coverage of transcript 3′ ends.
Median-normalized sequence read counts from genomic and input samples, and normalized GC-content, as a function of distance from 3′ transcription end sites. The sequence read densities and GC-content were calculated in 10 base-pair intervals, upstream of the 3′ ends.

