Figure 3.
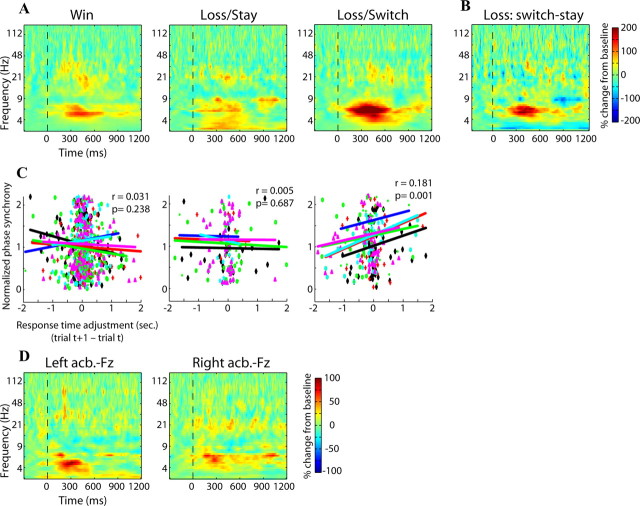
Inter-regional phase synchrony demonstrates that the nuclei accumbens were strongly phase synchronized during loss/switch trials, and the strength of this synchrony predicted subsequent response time adjustments. A shows interaccumbens phase synchrony for each condition; B shows the difference in phase synchrony between loss/switch and loss/stay (red colors indicate enhanced synchrony during loss/switch trials). C, The strength of interaccumbens phase synchrony on loss/switch trials predicted adjustments in response times on the subsequent trial. x-axis displays response time adjustment (subsequent–current trial; positive values mean the subsequent trial had a longer response time); y-axis displays Fisher-transformed phase synchrony values. Each dot is a single trial (unique colors/shapes for each patient), and lines correspond to correlation slope within each patient. D, Oscillatory phase synchrony between the nucleus accumbens and Fz was significantly greater compared with baseline but was not significantly different across conditions. Conditions are averaged together here and displayed separately in supplemental Figure S5, available at www.jneurosci.org as supplemental material.

