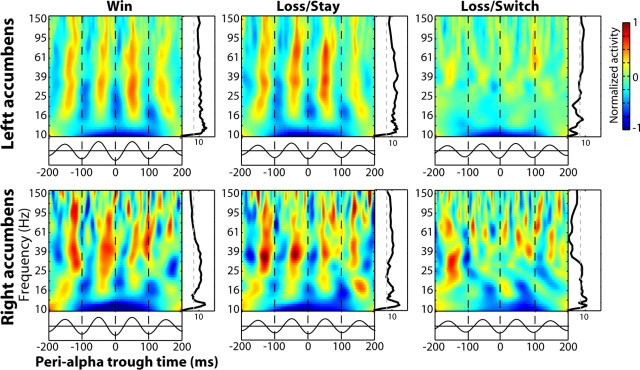
Figure 4.
Bursts of gamma power are synchronized with the phase of simultaneously recorded α. Time-frequency plots were time-locked to the trough of each α-filtered oscillation wave instead of to the onset of the stimulus. The black line below each plot shows the averaged α-filtered EEG waveform. The black lines to the right of each plot show statistical significance of gamma-α synchrony at each frequency band, obtained through data-based boot strapping. The dotted gray line marks statistical significance at p < 0.001, corrected for multiple comparisons across frequency bands.

