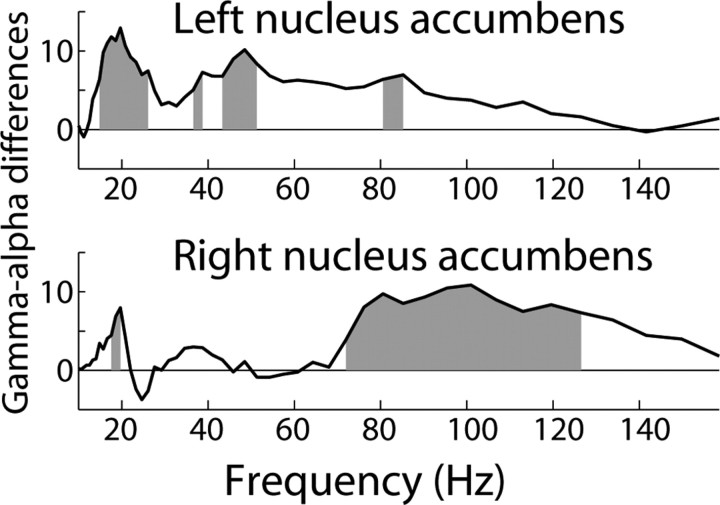
Figure 5.
Differences in gamma-α coupling between loss/stay and loss/switch trials. The x-axis represents frequency (in Hz), and the y-axis represents statistical difference values. The solid black line shows the difference in gamma-α coupling strength between loss/stay and loss/switch (positive values mean stronger coupling for loss/stay); gray regions indicate statistical significance at p < 0.001, corrected for multiple comparisons across frequency bands.

