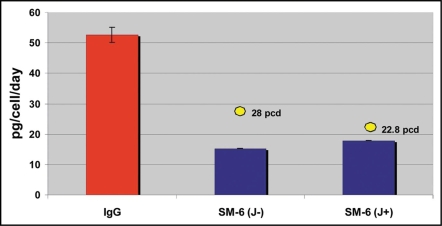
Figure 3.
Productivity of IgG and IgM expressing cell lines in PER.C6® cells, in a 7-day batch process. The average Qpmax values for the top 4 cell lines, for 6 independent IgG stable cell line generation programs, are shown in the red bar (n = 24). For the SM-6 (J−) and SM-6 (J+) IgMs, the average of the top 4 cell lines for each variant is shown in the blue bars. For each variant, the Qpmax for the leading cell line is indicated by the yellow circle.

